
- Title
-
Angiogenic factor AGGF1 is a general splicing factor regulating angiogenesis and vascular development by alternative splicing of SRSF6
- Authors
- Lv, W., Zhang, J., Lyu, D., Zhang, R., Xu, C., Ning, K., Li, M., Zhao, Y., Han, J., Wang, Q.K.
- Source
- Full text @ FASEB J.
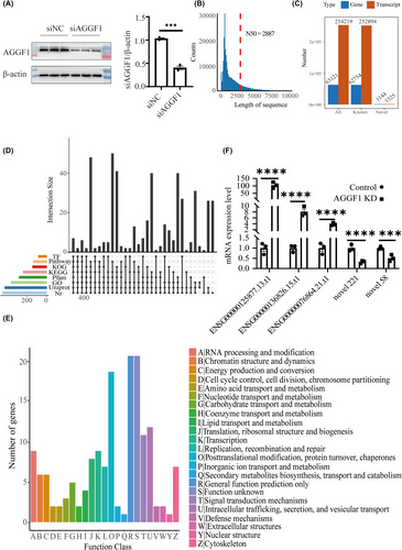
Nanopore full-length cDNA sequencing analysis identifies 1144 new genes in HPAEC. (A) Western blotting analysis of AGGF1 in HPAEC transfected with AGGF1-specific siRNA (siAGGF1) and negative control siRNA (siNC). β-Actin was used as a loading control. (B) Length distribution of non-redundant transcript sequences. The red dashed line indicates the length of N50. (C) Number of genes and transcripts identified in HPAEC. (D) UpSet plot of novel genes that can be annotated by eight functional databases. (E) Eukaryotic orthologous groups of proteins (KOG) annotation of novel genes identified in HPAEC. (F) Real-time RT-PCR analysis to validate the identification and differential expression of some unannotated genes in HPAEC transfected with siAGGF1 and siNC. (n = 3 samples/group; ***p < .001; ****p < 0.0001 vs. Control). |
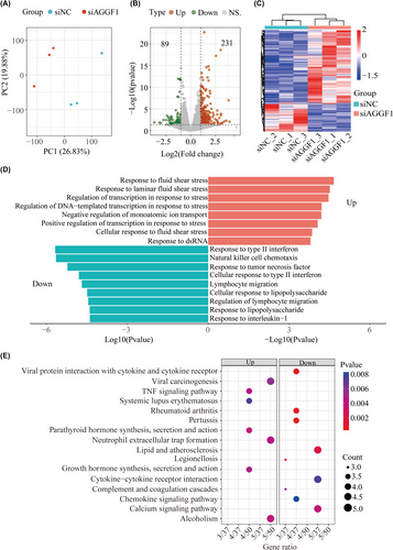
AGGF1 knockdown promotes extensive remodeling of gene expression in endothelial cells and identification of differential expressed genes (DEGs) between HPAEC transfected with AGGF1-specific siRNA (siAGGF1) and negative control siRNA (siNC) by full-length cDNA sequencing. (A) Principal compartment analysis of sequencing data from HPAEC transfected with siAGGF1 and siNC. (B) Volcano plot of DEGs in siAGGF1 HPAEC compared with siNC HPAEC. (C) Heatmap showing the correlation between the identified DEGs. Each column represents a sample, and each row represents a gene. (D) GO functional enrichment analysis of DEGs. (E) KEGG enrichment analysis of DEGs. Down, downregulated DEGs; Up, upregulated DEGs. |

AGGF1 knockdown alters alternative splicing and identification of differential alternative splicing (DAS) events in 436 genes. (A) Diagram of typical alternative splicing (AS) events. A3, alternative 3′ splice sites; A5, alternative 5′ splice sites; AF, alternative first exon; AL, alternative last exon; MX, mutually exclusive exons; RI, intron retention; SE, skipping exon. (B) AS events identified by full-length cDNA sequencing in each sample of HPAEC transfected with AGGF1-specific siRNA (siAGGF1) and negative control siRNA (siNC). (C) Volcano plot of differential AS events in the siAGGF1 group compared with the siNC group. (D) Heatmap of DAS events. (E) Number of different types of DAS events vs. the number of associated genes. (F) GO enrichment analysis of genes involved in DAS events. Down, downregulated DASs; Up, upregulated DASs. |
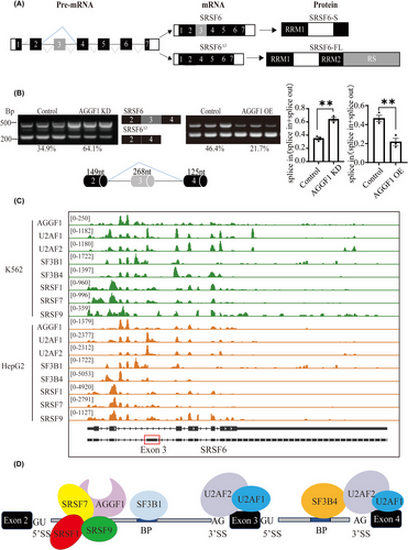
AGGF1 promotes exon 3 skipping of SRSF6 during alternative splicing. (A) Structure of SRSF6 pre-mRNA, two mature spliced RNA transcripts (SRSF6 with all exons and SRSF6Δ3 with deletion of exon 3), and two protein isoforms. Transcript SRSF6 is translated into a shorter SRSF6 protein with RS and part of RRM2 domain deleted, whereas transcript SRSF6Δ3 is translated into the full-length SRSF6 protein. (B) Semi-quantitative RT-PCR analysis to confirm the AS event of exon 3 skipping of SRSF6. Two alternatively spliced SRSF6 RNA transcripts are shown as two distinct bands on agarose gels, and were both abundant in HPAEC (control). AGGF1 knockdown or overexpression of FLAG-tagged AGGF1 altered AS event of exon 3 skipping of SRSF6 (n = 3 samples/group; **p < .01 vs. Control). (C) Genome browser view of the SRSF6 locus showing eCLIP signal for AGGF1, U2AF2, U2AF1, SF3B1, SF3B4, SRSF1, SRAF7, SRSF9 in K526 and HepG2 cells. eCLIP data were downloaded from ENCODE database (https://www.encodeproject.org/). (D) Results of eCLIP data from (C) showing the binding sites for AGGF1 and other splicing regulatory factors during spliceosome complex assembly at the 5′-splice site (5′SS), 3′-splice site (3′SS), branch point site (BP) in the pre-mRNA region spanning exons 2 to 4. |
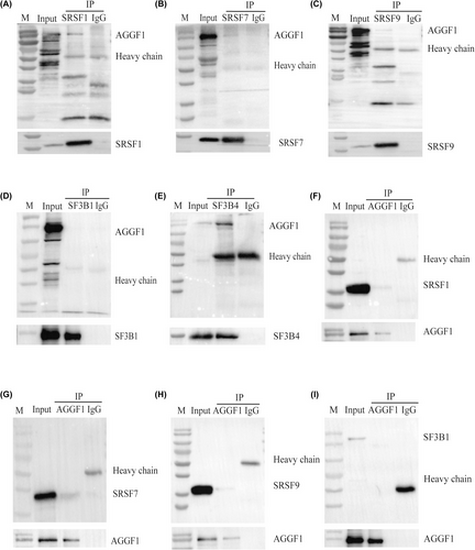
Co-IP analysis to validate the eCLIP interaction results. (A–E) Co-IP was performed using the anti-FLAG antibody, followed by Western blot analysis with the anti-GFP antibody. (F–I) Co-IP was performed using the anti-GFP antibody, followed by Western blot analysis with the anti-FLAG antibody. GFP-AGGF1 interacts with FLAG-SRSF1, FLAG-SRSF7, FLAG-SRSF9, and FLAG-SF3B4, but not with FLAG-SF3B1. |
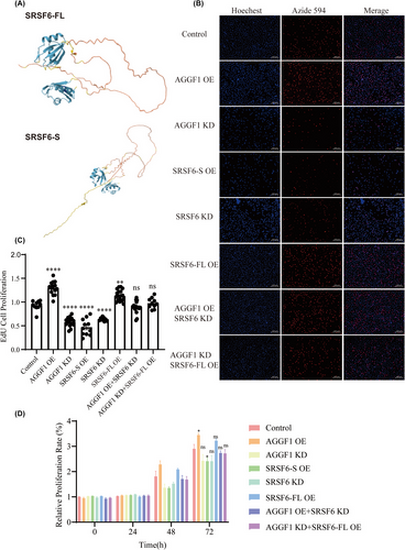
AGGF1 regulates endothelial cell proliferation by modulating SRSF6 alternative splicing. (A) Full-length SRSF6-FL protein and short SRSF6-S protein show distinctly different structures as predicted by AlphaFold in UniProt (https://www.uniprot.org/). (B) Cell proliferation analysis using EdU staining for EA.hy926 cells transfected with different siRNA (KD) or mammalian expression plasmid DNA (OE) or combination (n = 3 experiments). (C) Statistical plot of EdU cell proliferation ( n = 9-12 images from three experiments). **p < .01, ****p < .0001 versus control; ns, no significance. (D) Cell proliferation analysis using CCK8 kit for EA.hy926 cells transfected with different siRNA (KD) or mammalian expression plasmid DNA (OE) or combination (n = 3 experiments). *p < .05 versus control; ns, no significance. |
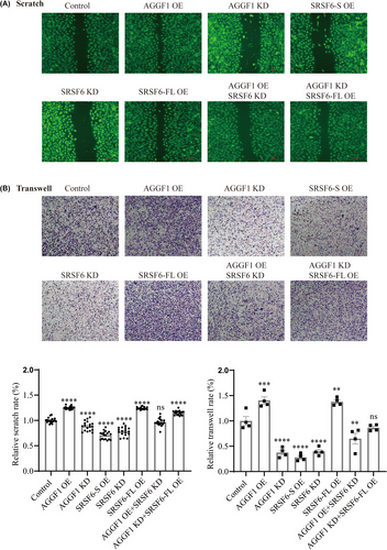
AGGF1 regulates endothelial cell migration by modulating SRSF6 alternative splicing. (A) Scratch assay for cell migration for EA.hy926 cells transfected with different siRNA (KD) or mammalian expression plasmid DNA (OE) or combination. The images were quantified and the data are shown on left bottom (n = 6 experiments). (B) Transwell assay for cell migration for EA.hy926 cells transfected with different siRNA (KD) or mammalian expression plasmid DNA (OE) or combination. The images were quantified and the data are shown on right bottom (n = 4 experiments). **p < .01, ***p < .001, ****p < .0001 versus Control; ns, no significance. |
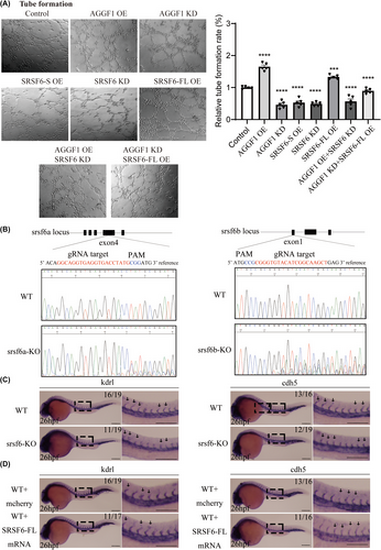
AGGF1 and SRSF6-FL promote capillary angiogenesis of EA.hy926 cells and ISV vascular development in zebrafish. (A) Capillary tube formation for angiogenesis for EA.hy926 cells transfected with different siRNA (KD) or mammalian expression plasmid DNA (OE) or combination (n = 5 experiments). ***p < .001, ****p < .0001 vs. Control; ns, no significance. (B) Sanger sequencing panels showing mosaic knockout (KO) of srsf6a and srsf6b in zebrafish at F0 using the CRISPR/Cas9 system. (C, D) Whole-mount in situ hybridization with markers genes kdrl and cdh5 for intersegmental vessels (ISVs) in 26 hpf zebrafish embryos. (C) KO of srsf6a and srsf6b impaired the development of ISVs. (D) Overexpression of the full-length SRSF6-FL mRNA (mCherrry RNA as negative control) enhanced the development of ISVs in zebrafish. Scale bar, 200 μm; n = 16 to 19 embryos per group. PHENOTYPE:
|
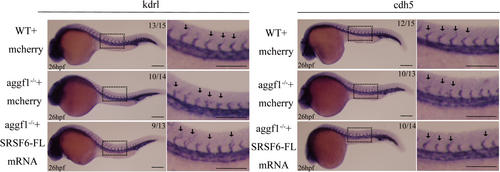
Overexpression of SRSF6-FL partially rescues the impaired ISV development in zebrafish embryos with KO of aggf1. Abnormal ISVs in aggf1 KO embryos were rescued by overexpression of SRSF6-FL by injection of SRSF6-FL mRNA, but not by negative control mCherry mRNA. Scale bar, 200 μm; n = 13–15 embryos per group. PHENOTYPE:
|