
- Title
-
Metabolomic and lipidomic profiling reveals convergent pathways in attention deficit hyperactivity disorder therapeutics: Insights from established and emerging treatments
- Authors
- Grzymala, B., Þorsteinsson, H., Halldórsdóttir, D.Þ., Sveinsdóttir, H.S., Sævarsdóttir, B.R., Norton, W.H.J., Parker, M.O., Rolfsson, Ó., Karlsson, K.Æ.
- Source
- Full text @ J. Pharmacol. Exp. Ther.

adgrl3.1 mutants and WTs have distinct whole-body metabotypes. (A) Principal component (PC) analysis score plot differentiating metabolomes of adgrl3.1 mutant (red) and WT (blue) zebrafish larvae. The 2 components explained 81.4% of the overall variation, showing clear separation between groups. Each group consisted of 3 biological replicates, with 50 pooled larvae per replicate. (B) Volcano plot of identified metabolites. Blue dots indicate significant downregulation, red dots significant upregulation, and gray dots nonsignificant changes. Comparison between adgrl3.1 mutants and WTs revealed 4 differential metabolites, 2 downregulated and 2 upregulated. Differential metabolites were identified through an FC of ≥1.2 or ≤0.83 and an FDR-adjusted P value of ≤.05. (C) Metabolic pathways detected in adgrl3.1 mutant and WT zebrafish larvae. Five metabolic pathways were classified as both statistically significant (P ≤ .05) and high-impact (impact factor ≥0.5); these pathways are marked with their names. Significantly altered pathways were identified through quantitative enrichment analysis using the KEGG pathway database. (D) Volcano plot of identified lipids. Blue dots indicate significant downregulation, red dots significant upregulation, and gray dots nonsignificant changes. Comparison between adgrl3.1 mutants and WTs revealed 10 significantly altered lipids, 3 downregulated and 7 upregulated. Significantly altered lipids were identified through an FC of ≥1 or ≤0.5 and an FDR-adjusted P value of ≤.05. PHENOTYPE:
|

The effect of stimulant methylphenidate on the whole-body metabolome of adgrl3.1 mutant larvae. Volcano plot of identified (A) metabolites and (B) lipids. Blue dots indicate significant downregulation, red dots significant upregulation, and gray dots nonsignificant changes. Comparison between methylphenidate-treated and untreated adgrl3.1 mutants revealed (A) 3 differential metabolites, 2 downregulated and 1 upregulated, and (B) 3 significantly altered lipids, 2 downregulated and 1 upregulated. Each group consisted of 3 biological replicates, with 50 pooled larvae per replicate. Differential metabolites were identified through an FC of ≥1.2 or ≤0.83 and an FDR-adjusted P value of ≤.05. Significantly altered lipids were identified through an FC of ≥1 or ≤0.5 and an FDR-adjusted P value of ≤.05. |
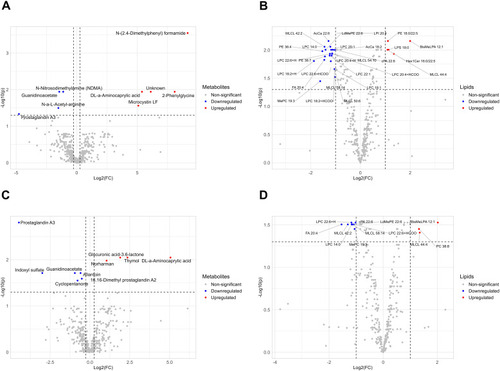
The effect of nonstimulants (A and B) atomoxetine and (C and D) guanfacine on the whole-body metabolome of adgrl3.1 mutant larvae. Volcano plot of identified (A, C) metabolites and (B, D) lipids in adgrl3.1 mutant larvae treated with either (A, B) atomoxetine or (C, D) guanfacine compared with untreated adgrl3.1 mutant larvae. Blue dots indicate significant downregulation, red dots significant upregulation, and gray dots nonsignificant changes. Metabolic changes in (A) atomoxetine-treated larvae included 9 differential metabolites, with 4 downregulated and 5 upregulated, while those in (C) guanfacine-treated larvae included 10 differential metabolites, with 6 downregulated and 4 upregulated. Lipid changes in (B) atomoxetine-treated larvae included 25 significantly altered lipids, with 20 downregulated and 5 upregulated, while those in (D) guanfacine-treated larvae included 11 significantly altered lipids, with 8 downregulated and 3 upregulated. Each group consisted of 3 biological replicates, with 50 pooled larvae per replicate. Differential metabolites were identified through an FC of ≥1.2 or ≤0.83 and an FDR-adjusted P value of ≤.05. Significantly altered lipids were identified through an FC of ≥1 or ≤0.5 and an FDR-adjusted P value of ≤.05. cPA, cyclic phosphatidic acid; LdMePE, lysodimethylphosphatidylethanolamine; MePC, methyl phosphatidylcholine. |

The effect of novel treatment amlodipine on the whole-body metabolome of adgrl3.1 mutant larvae. Volcano plot of identified (A) metabolites and (B) lipids. Blue dots indicate significant downregulation, red dots significant upregulation, and gray dots nonsignificant changes. Comparison between amlodipine-treated and untreated adgrl3.1 mutant larvae revealed (A) 1 downregulated metabolite and (B) 1 downregulated lipid. Each group consisted of 3 biological replicates, with 50 pooled larvae per replicate. Differential metabolites were identified through an FC of ≥1.2 or ≤0.83 and an FDR-adjusted P value of ≤.05. Significantly altered lipids were identified through an FC of ≥1 or ≤0.5 and an FDR-adjusted P value of ≤.05. |

ZFIN is incorporating published figure images and captions as part of an ongoing project. Figures from some publications have not yet been curated, or are not available for display because of copyright restrictions. PHENOTYPE:
|