
- Title
-
Treatment of overactive KATP channels with glibenclamide in a zebrafish model and a clinical trial in humans with Cantú syndrome
- Authors
- Kleinendorst, L., Siegelaar, S.E., Roessler, H.I., Meiwand, L., van den Boogaard, M., de Bruin-Bon, R.H.A.C.M., van Duinen, K.F., Planken, R.N., Jaspars, E.H., Kemperman, P.M.J.H., Bouma, B.J., Nichols, C.G., Bekkenk, M.W., van Haaften, G.W., van Haelst, M.M.
- Source
- Full text @ Sci. Rep.

Overview of the study visits. QoL: Quality of Life; MRI: Magnetic Resonance Imaging. |
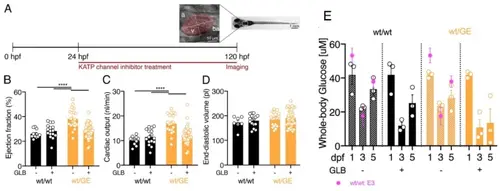
Glibenclamide corrects CS-related cardiac phenotype in Sur2wt/GE larvae. (A) Sur2wt/GE larvae were exposed to various KATP inhibitors over a period of 96 h starting at 1dpf. Larvae treated with DMSO were used as a vehicle control. (B-D) CS-associated cardiac features, namely ejection fraction, cardiac output and end-diastolic volume were assessed in Sur2wt/GE larvae after GLB treatment using high-speed video imaging. For all graphs, significance was determined by one-way ANOVA and subsequent post-hoc Tukey’s test for pairwise comparison: * p<0.05; ** p<0.01; *** p<0.001; **** p<0.0001. Data shown as mean ± SEM. Sample size: (B-D) wt/wt(-), n = 10; wt/wt(+), n = 16; wt/GE(-), n = 19; wt/GE(+), n = 41; All embryos analyzed originated from group matings of adult Sur2wt/GE zebrafish. (E) Chronic exposure to glibenclamide reduces whole-body glucose levels in CS zebrafish larvae. Absolute glucose levels in larval lysates consisting of a pool of 10 larvae each were measured applying a highly sensitive glucose assay kit. Glucose was measured in WT fish and fish prior to glibenclamide exposure at 1 dpf and after at 3 and 5 dpf. Mean whole-body glucose measurements from WT and Sur2wt/GE control and GLB treatment group. Additionally, absolute glucose levels of WT fish grown in E3 medium are shown. PHENOTYPE:
|
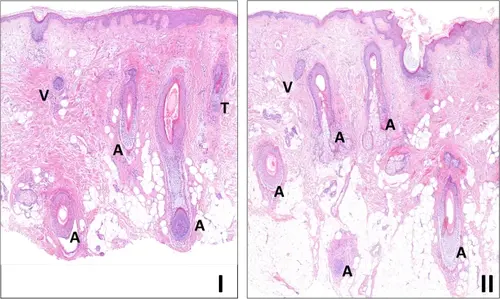
The effects in the skin biopsies. Histology of skin biopsies before (I) and after (II) treatment, taken from the scalp at the hairline of case 2 (H&E stained, 100x), reveals essentially identical features, as assessed by the pathologist at our center, who has experience in evaluating such skin biopsies, in collaboration with the involved dermatologists. The hair follicles in both samples are predominantly in the anagen phase (A). In the biopsy before treatment (I), one hair follicle in the telogen phase (T) and one vellus hair follicle (V) are also visible. |