FIGURE SUMMARY
Title

Semaphorin 3f and post-embryonic regulation of retinal progenitors

Authors
Kalifa, A., Hehr, C.L., Shewchuk, K.L., Mori-Kreiner, R., Standing, S., Halabi, R., McFarlane, S.
Source
Full text @ PLoS Genet.

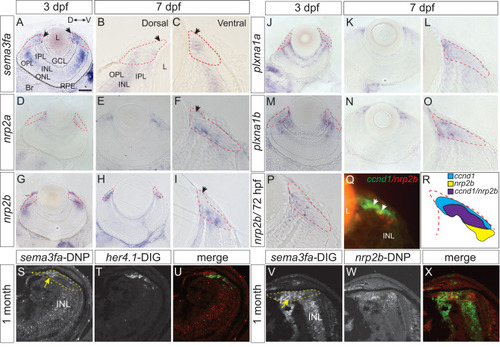
Expression of mRNAs for Sema3fa and its receptors in the larval and juvenile CMZ.

Plastic sections through the eyes of WM ISH of 3 (A, D, G, J, M, P) and 7 (B, C, E, F, H, I, K, L, N, O) dpf larvae for sema3fa (A-C) and potential receptors, nrp2a(D-F), nrp2b(G-I, P), plxna1a(J-L), and plxna1b(M-O). The CMZ (red dashed lines) is shown enlarged at 7 dpf (B, C, F, I, L, O). Peripheral-most CMZ lacks expression (arrows B, C, F, I). Q) Double FISH for nrp2b (red) and ccnd1 (green) mRNA in the 72 hpf CMZ. R) Schematic representing general organization of ccnd1 (blue) and nrp2b (yellow) expression in the CMZ. The two expression domains exhibit some overlap (purple). S-X) Double FISH on sections of 1-month retinas with a DNP riboprobe for sema3fa (S) and DIG probe for her4.1 (T; merge in U), and with a DIG probe for sema3fa (V) and DNP probe for nrp2b (W; merge in X). Expression of sema3fa in CMZ (dotted yellow line) indicated by yellow arrows. Orientation bar in A applies to A, D, E, G, H, J, K, M, N. D, dorsal; GCL, ganglion cell layer; INL, inner nuclear layer; IPL, inner plexiform layer; L, lens; ONL, outer nuclear layer; outer plexiform layer, OPL; RPE, retinal pigment epithelium; V, ventral. Scale bar in A is 50 µm for A, D, E, G, H, J, K, M, N and 10 µm for all other panels.

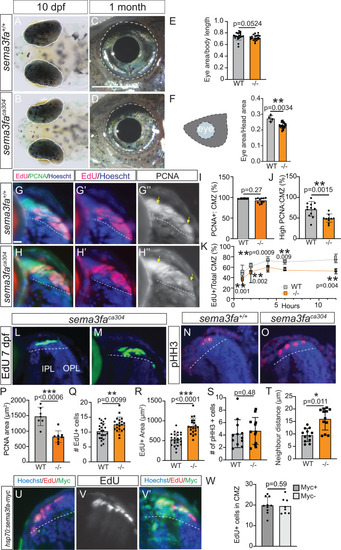
Larval eye size and CMZ proliferating progenitors impacted in the sema3faca304 mutant.

A-D) Dorsal view at 10 dpf (A, B) and lateral view at 1 month (C, D) of eyes (outlined in white dashed line) in WT (A, C) and sema3faca304 (B, D) fish. E-F) Eye area normalized to nose to swim bladder length at 10-11 dpf (E) and to area of the head (measured from the nasal-most aspect of the head to the anterior boundary of the gills) at 1 month (F) for WT and sema3faca304 fish. Pooled from N = 2 independent replicates. G-K) Cumulative EdU labelling of WT and sema3faca304 CMZ by bathing 72 hpf larvae in an EdU bath for 1-12 hours. One hour EdU labelling (G, G′, H, H′) of the CMZ in transverse retinal sections, also processed for PCNA immunolabelling (G, H, G′′, H′′) and for Hoescht to label nuclei (blue). The yellow arrows indicate uniform, intense PCNA immunolabel across the CMZ in WT (G′′) but lowered PCNA immunoreactivity in the mutant central CMZ (H′′). Graphs showing the percentage of Hoescht-labelled nuclei in the CMZ that are PCNA+ (I), the area of intense PCNA expression normalized to CMZ area (J), and the percentage of CMZ Hoescht-labelled cells that are EdU+ for each time point (K). Data pooled from N = 2 independent replicates. L-O) Retinal cryosections of 7 dpf CMZ showing EdU-labelled progenitors after a 4-hour EdU pulse (L, M) and immunolabelling for pHH3 (N, O). P-T) Graphs representing quantitation from retinal sections of the area of PCNA immunolabelling for the dorsal and ventral retina (P; N = 2 independent replicates), numbers of EdU+ cells (Q; N = 3 independent replicates) and the area of the CMZ they occupy (R; N = 3 independent replicates) from horizontal retinal sections, numbers of pHH3 + cells (S; N = 3) and the mean distance between them (T; N = 3) from horizontal retinal sections. U-W) Quantitation (W; N = 3 independent replicates) of the numbers of EdU+ progenitors (8 hour pulse) in Sema3fa-Myc-positive and Sema3fa-Myc-negative dorsal CMZ in transverse retinal sections of heat-shocked 5 dpf larvae injected at the one-cell stage with a construct with sema3fa-myc under the control of the hsp70 promoter. The ventral (U) and dorsal (V, V′) CMZ of a single retinal section from a heat-shocked larvae, showing little (U) or Myc (V′; green) immunolabelling for Sema3fa-myc+ along with Hoechst (blue) and EdU (U, V, V′; red) label. For all graphs, values represent individual embryos, error is standard deviation, and Mann Whitney-U test was used to test statistical significance. IPL, inner plexiform layer; OPL, outer plexiform layer. Scale bar in C represents 500 µm for A, B and 1000 µm for C, D; scale bar in G is 10 µm for G-H, L-O and U-V.

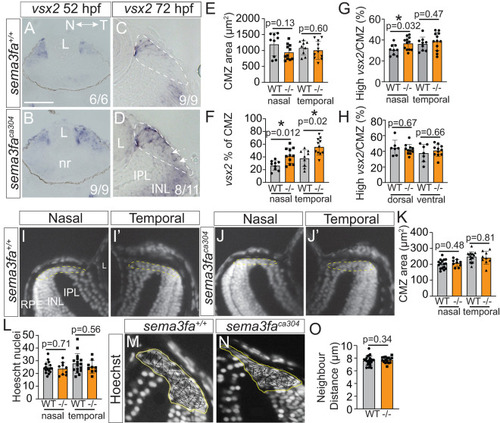
Gross CMZ development and anatomy unimpacted by Sema3fa loss.

A-D) Retinal sections of WM ISH for vsx2 that becomes restricted to the proliferative retinal periphery in WT (A) and sema3faca304 (B) fish at 52 hpf. At 72 hpf (C-D), vsx2 is expressed at high levels by distal progenitors of the CMZ in both genotypes, but is also expressed at low levels broadly through the mutant nasal CMZ (arrows). Note normal expression of vsx2 by INL cells in both genotypes. n’s represent numbers of fish with represented expression pattern. E-H) Quantitation of the vsx2 expression domain within the CMZ. In sections through the central retina, the vsx2 ISH expression domain and CMZ were outlined, using the edge of the inner and outer plexiform layers to mark the central limit of the CMZ; average CMZ area (E), total vsx2 area normalized to CMZ area (F), and high vsx2 expression area normalized to CMZ area (G, H). I-J) Hoechst labelling of nuclei in horizontal cryostat retinal sections of 7 dpf WT (I) and sema3faca304 (J) nasal (I, J) and temporal (I′, J′) CMZ. K-O) Quantitative analysis of WT and sema3faca304 CMZ at 7 dpf from horizontal sections; (K) CMZ area; (L) Number of Hoechst-labelled nuclei; (O) Average distance between nearest neighbours, represented in M and N. INL, inner nuclear layer; IPL, inner plexiform layer; nr, neural retina; L, lens; RPE, retinal pigment epithelium. For all graphs, data is from N = 3 independent replicates, error bars are standard deviation, values represent individual embryos, and statistics represent Mann Whitney U-test. Scale bar in A is 150 µm for A, B and 40 µm for C, D, I-J, M, N.

Disruption of retinal progenitor cell domain with loss of Sema3fa.

A-E) Zone 1 markers bmp4 (D, E) and col15a1b, at low (A, B) and high magnification (A′, B′), from plastic horizontal (A, B) and transverse (D, E) sections of WM ISH preparations. Schematic of the zonal structure of the CMZ (C). F-G) Average col15a1b (F; N = 2 independent experimental replicates) and dorsal bmp4 (G; N = 3 independent experimental replicates) expression domain areas normalized to CMZ area. H-M) Immunolabelling of distal CMZ cells for Crb2a/zs4 (H, I) and aPKC (J, K), and plastic sections of WM ccnd1 ISH (L, M). Arrowheads point to label (H, I, J, K) in the distal CMZ that contains stem cells. n’s represent numbers of embryos analysed that show WT-like expression (H-L), and dispersed ccnd1 expression (M; arrow). N) Fold change of col15a1b mRNA of sema3faca304 relative to WT 72 hpf eyes. Each dot is an independent biological replicate. Paired two-tailed t-test performed on delta Ct values. O) Average normalized ccnd1 ISH expression domain area for 72 hpf nasal/temporal CMZ in horizontal sections (O; N = 3 independent replicates). P) Fold change of ccnd1 (Q) mRNAs of sema3faca304 relative to WT 72 hpf eyes. Each dot is an independent biological replicate. Paired two-tailed t-test performed on delta Ct values. Q) Average normalized ccnd1 ISH expression domain area in 72 hpf dorsal CMZ in transverse sections (N = 3 independent replicates). For graphs in F, G, O, Q points are individual embryos, error is standard deviation, and statistics are Mann Whitney U-test. IPL, inner plexiform layer; L, lens; N, nasal; OPL, outer plexiform layer; RPE, retinal pigment epithelium; T, temporal. Scale bar in A is 100 µm for A, B; 30 µm for A′, B′, D, E, H-M.

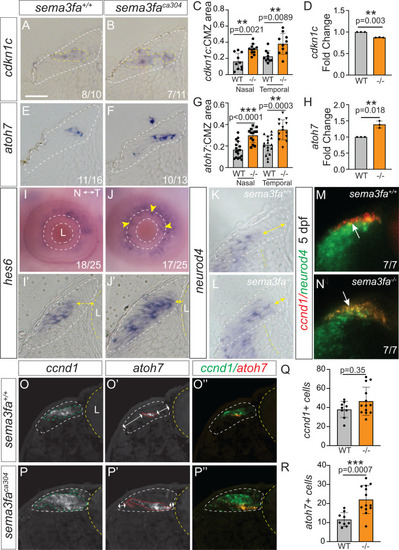
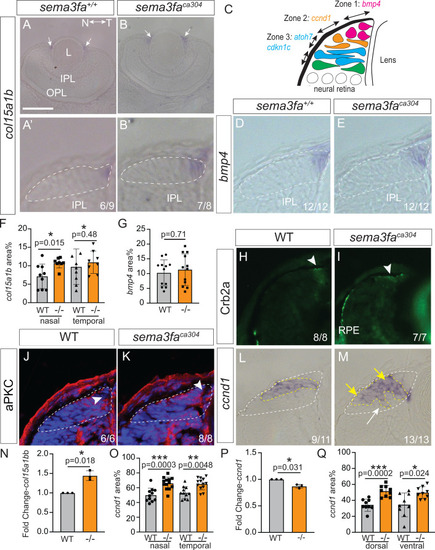
Disrupted organization of committed CMZ progenitors in the absence of Sema3fa.

WM ISH for Zone 3 markers shown in 7 µm plastic sections (A, B, E, F, I′, J′, K, L), z-stack of confocal optical sections (M, N), or lateral WM (I, J). A-H)cdkn1c (A, B) and atoh7(E, F) ISH at 72 hpf, graphs of cdkn1c(C) (pooled data from N = 2 independent replicates) and atoh7(G) (pooled data from N = 4 independent replicates) mRNA domain areas normalized to CMZ area; Points for graphs are independent biological replicates, errors are standard deviation, and statistics are Mann Whitney U-test. Fold change of cdkn1c (D) and atoh7 (H) mRNA levels in 72 hpf eyes relative to WT as measured by RT-qPCR (paired Student’s t-test of delta CT values, with each data point an average of 3 technical replicates of RT-qPCR performed on mRNA isolated from n = 30 eyes). I-J) Zone 3 hes6 marker in the 72 hpf eye in WM (I, J) and in plastic section (I′, J′). Expansion of hes6 in situ label to the most peripheral CMZ adjacent to the lens in sema3faca304 eye (yellow arrows). n’s refer to the numbers of eyes with significant (J) or little or no (I) hes6 ISH label in the CMZ immediately adjacent to the lens. K, L) Plastic section of Zone 3 neurod4 mRNA in the 72 hpf CMZ showing expansion (yellow arrows) of the neurod4 label towards peripheral CMZ. M, N) Confocal images of 72 hpf CMZ processed for WM double FISH for ccnd1 (red) and neurod4 (green). There is more co-expression in mutant than WT (compare arrows in M and N). n’s refer to the numbers of larvae showing WT levels of co-expression (M) and enhanced co-localization (N). O, P) Double FISH for ccnd1 (O, P) and atoh7 (O′, P′), and merge (O′′, P′′; green-ccnd1, red-atoh7) for WT (O) and mutant (P) 72 hpf CMZ. Q-R) Quantitation of Hoescht-labelled nuclei in ccnd1+ (Q) and atoh7+ (R) expression domains in transverse retinal sections processed for double FISH for ccnd1 and atoh7. Points for graphs are individual larva, errors are standard deviation, and statistics are Mann Whitney U-test (N = 2 independent experiments). Scale bar in A is 20 µm for all panels except I, J (100 µm).

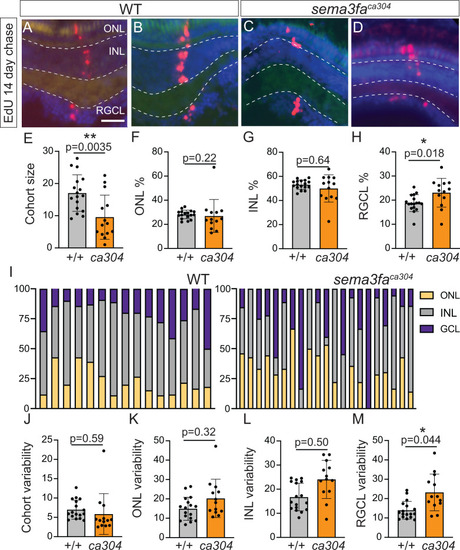
Altered size and cell composition of CMZ-derived radial cohorts with loss of Sema3fa.

EdU labelling of retinas of 20 dpf zebrafish larvae incubated for 4 hrs with EdU at 5 dpf. A-D) Examples of radial cohorts of EdU-labelled cells in the central retina of separate WT (A, B) and sema3faca304 (C, D) fish. Panels are separate examples from different fish. E) Number of EdU+ cells (counted in every second section) in each radial cohort averaged per retina (WT, n = 17 larvae; mutant, n = 14 larvae; N = 2 independent replicates). F-H) The averaged distribution of EdU+ cells across the three major layers of the neural retina within individual radial cohorts of each larvae; outer nuclear layer (ONL) (F), inner nuclear layer (INL) (G), and retinal ganglion cell layer (RGCL) (H). A larger percentage of cells of the radial cohorts reside within the RGC layer in the mutant as compared to the WT. I) Layer distribution of cells for each radial cohort of a representative WT and sema3faca304 retina. J-M) Percentages of cells in each retinal lamina were calculated for individual radial cohorts, and these percentages averaged for each retina (WT, n = 17 larvae; mutant, n = 14 larvae). The standard deviations for these averages are graphed in J-M. For all graphs, data points represent individual embryos, error bars are standard deviation. Statistical analyses use Mann Whitney U-test for E-H and a Levene’s test for the equality of variance for J-M. INL, inner nuclear layer; ONL, outer nuclear layer; RGCL, retinal ganglion cell layer. Scale bar is 50 µm for A-D.

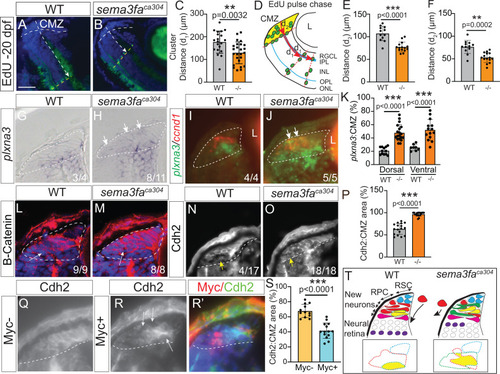
Sema3fa may promote smooth movement of progenitors through CMZ by downregulating cell adhesion.

A-B) Radial EdU+ cohorts (green) that have moved away (dotted arrows) from the CMZ in WT (A) and sema3faca304 retina (B). A 4 hour EdU pulse was performed at 7 dpf and retinal sections from larvae fixed at 20 dpf processed for EdU labelled cells. C) Average distance (d1; D) of EdU+ radial cohorts from the CMZ in sema3faca304 is reduced significantly as compared to WT. N = 3 independent replicates. D) Schematic showing measurement of the distance (d1) moved from the central CMZ edge by radial cohorts of EdU+ cells (green) 2 weeks post-EdU label, and the distance (d2) moved from the peripheral CMZ edge by the central-most cohort of EdU+ cells (green) 3 days post-EdU label. E-F) Graphs showing the average distance (d2; D) of each radial cluster of EdU-labelled CMZ-derived cells from the peripheral-most CMZ, as measured in 9 dpf dorsal (E) and ventral (F) retina. N = 2-3 independent replicates. G-H) Retinal sections of the CMZ from WM ISH for plxna3 mRNA in WT (G) and sema3faca304 (H) 72 hpf fish. n’s represent the numbers of larva showing either WT (G) or expanded (H; arrows) plxna3 expression. I-J) WT (I) and sema3faca304(J) CMZ processed by double FISH for plxna3 (green) and ccnd1 (red) mRNA. plxna3-expressing CMZ cells are found ectopically (arrows) in the peripheral CMZ and co-express ccnd1 (yellow). n’s represent the number of individual embryos that exhibit separated (I) or overlapped (J) ccnd1/plxna3 expression domains. K) Quantitation of plxna3 expression domain normalized to CMZ area of 72 hpf horizontal retinal sections (N = 3 independent replicates). L-O) Immunolabel for ß-catenin (L, M) and Cdh2 (N, O) in the 72 hpf CMZ. Arrows indicate reduced immunolabel of the central CMZ in WT but not mutant. n’s indicate the numbers of fish showing either preferential, bright label of the more distal CMZ (L, N) or immunolabel distributed across both the distal and central CMZ (M, O). P) Quantitation of the percentage of the CMZ exhibiting robust Cdh2 immunostaining fluorescent label. Data from N = 4 independent replicates. Q-S) Cdh2 immunolabelling of the CMZ in larvae injected at the 1-cell stage with a hsp70:sema3fa-myc construct and heat-shocked at 38°C for 60 minutes at 52 hpf and fixed 24 hours later. Quantitation (S) of the domain of high Cdh2 expression as a percentage of CMZ area in CMZ exhibiting Myc+ cells (R, R’; red) and no Myc+ cells (Q). Data from N = 3 independent replicates. For all graphs, dots represent individual fish, error is standard deviation, and Mann Whitney U-test was performed for statistical analysis. T) Schematic of the CMZ of WT and sema3faca304 fish showing normal retinal stem cell (RSC) localization to the CMZ periphery, but disrupted organization of committed and proliferating (retinal progenitor cells; RPC) in the mutants. Fewer neurons (purple) are produced and move less distance from the CMZ in mutants. We propose a model whereby Sema3fa negatively regulates cell adhesion molecule expression by progenitors. As such, sema3faca304 CMZ progenitors are more adhesive and do not move smoothly through the CMZ (red cells, arrows). Boxes show impact on the zonal organization of the CMZ. Scale bar in A is 100 µm for A, B and 25 µm for G-J, L-O, Q-R.

Acknowledgments
This image is the copyrighted work of the attributed author or publisher, and ZFIN has permission only to display this image to its users. Additional permissions should be obtained from the applicable author or publisher of the image. Full text @ PLoS Genet.