
- Title
-
Disrupted transcriptional networks regulated by CHD1L during neurodevelopment underlie the mirrored neuroanatomical and growth phenotypes of the 1q21.1 copy number variant
- Authors
- Lemée, M.V., Loviglio, M.N., Ye, T., Tilly, P., Keime, C., Weber, C., Petrova, A., Klein, P., Morlet, B., Wendling, O., Jacobs, H., Tharreau, M., Geneviève, D., Godin, J.D., Romier, C., Duteil, D., Golzio, C.
- Source
- Full text @ Nucleic Acids Res.
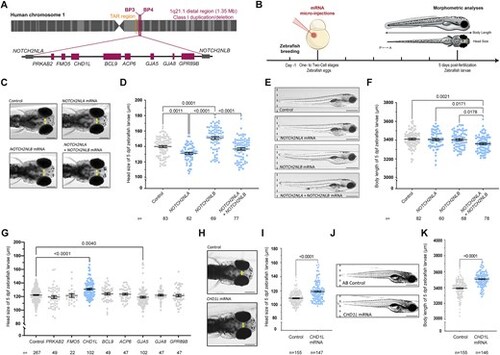
In vivo overexpression of the genes from the 1q21.1 distal region in zebrafish. (A) Schematic representation of the human 1q21.1 BP3–BP4 distal region showing eight genes comprised in the region and NOTCH2-paralogs NOTCH2NLA and NOTCH2NLB located at the breakpoints. (B) Schematic representation of the experimental procedure including micro-injection of mRNA in one- to two-cell stage zebrafish embryos and morphometric analyses at 5 dpf for the head size and the body length of zebrafish larvae. (C) Dorsal views of the head of control larvae and larvae injected with NOTCH2NLA mRNA (50 pg), NOTCH2NLB mRNA (50 pg) or NOTCH2NLA+ NOTCH2NLB mRNA (50 + 50 pg) at 5 dpf. Double-ended arrows indicate distance between the eyes. (D) Dot plot showing the distance between the eyes (head size) of control larvae and larvae injected with NOTCH2NLA mRNA (50 pg), NOTCH2NLB mRNA (50 pg), or NOTCH2NLA+ NOTCH2NLB mRNA (50 + 50 pg) at 5 dpf. Data shown as mean ± SEM of a least triplicate batches; Kruskal–Wallis test. (E) Lateral view of control larvae and larvae injected with NOTCH2NLA mRNA (50 pg), NOTCH2NLB mRNA (50 pg) or NOTCH2NLA+ NOTCH2NLB mRNA (50 + 50 pg) at 5 dpf. (F) Dot plot showing the body length measurements of control larvae and larvae injected with NOTCH2NLA mRNA (50 pg), NOTCH2NLB mRNA (50 pg), or NOTCH2NLA+ NOTCH2NLB mRNA (50 + 50 pg) at 5 dpf. Data shown as mean ± SEM of at least triplicate batches per condition; ordinary one-way analysis of variance (ANOVA) test. (G) Dot plot showing the distance between the eyes (head size) of 5 dpf control larvae and larvae injected with each of the eight human genes from the 1q21.1 distal region. Data shown as mean ± SEM of a least triplicate batches per gene; Kruskal–Wallis test. (H) Dorsal views of control and larvae injected with CHD1L mRNA (100 pg) at 5 dpf. Double-ended arrows indicate distance between the eyes. (I) Dot plot showing the distance between the eyes (head size) of control and CHD1L mRNA-injected larvae (100 pg) at 5 dpf. Data shown as mean ± SEM of a least triplicate batches; Mann–Whitney test. (J) Lateral views of control and CHD1L mRNA-injected larvae (100 pg) at 5 dpf. (K) Dot plot showing the body length measurements of control or injected larvae with CHD1L mRNA (100 pg) at 5 dpf. Data shown as mean ± SEM of triplicate batches; Mann–Whitney test. To simplify the visualization of the data, the nonsignificant P-values are not shown on the graphs. Scale bars: 200 μm [panels (C) and (H)] and 500 μm [panels (E) and (J)]. |
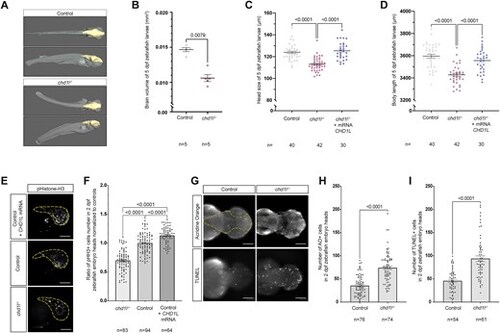
Loss of chd1l recapitulates mirrored neuroanatomical phenotypes of the 1q21.1 distal deletion in zebrafish. (A) 3D reconstitution of 5 dpf control and chd1l−/− zebrafish larvae acquired by HREM. The brain volume is shown in yellow. (B) Dot plot showing the quantification of brain volume of 5 dpf control and chd1l−/− zebrafish larvae. Data shown as mean ± SEM of a representative batch; Student’s t-test. (C, D) Dot plot showing the rescue of chd1l−/- phenotypes for head size and body length upon injection of CHD1L mRNA (100 pg) in chd1l −/− larvae compared to control larvae at 5 dpf, respectively. Data shown as mean ± SEM of triplicate batches; ordinary one-way ANOVA. (E) Lateral views of 2 dpf zebrafish heads for mutant chd1l−/−, control and CHD1L mRNA-injected larvae stained with phospho-histone H3 (pHH3; M-phase marker). Dotted yellow lines indicate quantified head areas. (F) Dot plot showing the pHH3 ratio of proliferating cells in the heads of 2 dpf chd1l−/− and CHD1L mRNA-injected larvae normalized to control. Data shown as mean ± SEM of triplicate batches; ordinary one-way ANOVA. (G) Dorsal views of 2 dpf heads of control and chd1l−/- mutant larvae stained with Acridine Orange (AO) or TUNEL. Dotted yellow line indicates quantified head area. (H) Dot plot showing the number of AO-positive cells in the heads of 2 dpf control and chd1l−/− mutant larvae. Data shown as mean ± SEM of triplicate batches; Mann–Whitney test. (I) Dot plot showing the number of TUNEL-positive cells in the heads of 2 dpf control and chd1l−/− mutant larvae. Data shown as mean ± SEM of triplicate batches; Mann–Whitney test. To simplify the visualization of the data, the nonsignificant P-values are not showed on the graphs. Scale bars: 100 μm. |
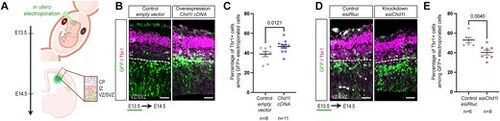
Dosage changes of Chd1l control neuronal production in transient mouse model. (A) Schematic of in utero electroporation. Mouse embryos are electroporated at E13.5, mouse brain are dissected at E14.5 and stained for Tbr1 neuronal marker. Double GFP-positive and Tbr1-positive cells representing the newborn neurons are counted in a defined area in the VZ/SVZ. (B) E14.5 mouse brain slices for control and Chd1l overexpressant conditions. (C) Dot plot showing the percentage of Tbr1-positive cells among the electroporated GFP-positive cells from the defined area in E14.5 mouse brains from control or electroporated with Chd1l expression vector. Data shown as mean ± SEM, electroporated and imaged embryos were from five different litters for control condition and from six different litters for Chd1l overexpression condition; Student’s t-test. (D) E14.5 mouse brain slices for control and knockdown Chd1l conditions. (E) Dot plot showing the percentage of Tbr1-positive cells among the electroporated GFP-positive cells in E14.5 mouse brains from control or electroporated with esiChd1l RNA. Data shown as mean ± SEM, electroporated and imaged embryos were from three different litters for esiRluc condition and from four different litters for esiChd1l condition; Student’s t-test. CP, cortical plate ; IZ, intermediate zone ; VZ/SVZ, ventricular/subventricular zones. Scale bars: 50 μm. |
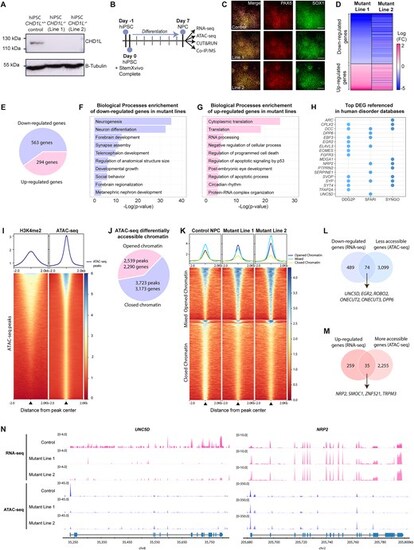
Loss of CHD1L perturbs expression and chromatin accessibility of neurogenesis-associated genes in hNPC. (A) Western blot analysis of CHD1L protein level in control hiPSC CHD1L+/+ and in the two isogenic CHD1L−/− cell lines generated by CRISPR-Cas9 editing showing the absence of CHD1L protein in mutant lines. (B) Schematic representation of human neural progenitor cells (hNPC) generation from hiPSC and subsequent analysis pipeline. (C) Immunostainings of hiPSC-derived hNPC with PAX6 and SOX1 neural progenitor markers. Scale bars: 100 μm. (D) Heatmap of the DEGs in hNPC Mutant Line 1 compared to Mutant Line 2 showing similar expression profiles between both mutants. (E) Pie chart of DEGs in CHD1L−/− hNPC compared to control hNPC (FDR < 0.05). (F, G) Gene Ontology Biological Processes enrichment of the downregulated and upregulated genes in mutant hNPC, respectively. (H) Dot plot of referenced genes in indicated databases associated with human disorders and synaptogenesis function among the 52 most DEG (|log2FC|> 1; FDR < 0.05) in CHD1L mutant hNPC. (I) Average tag density profiles and corresponding heatmap representation of tag density map of H3K4me2 CUT&RUN peaks, ± 2 kb from peak center of ATAC-seq peaks from control hNPC. (J) Pie chart of differentially accessible chromatin sites in CHD1L−/− mutant hNPC (Line 1 and Line 2 combined) compared to control hNPC. (K) Tag density map of control, Mutant Line 1 and Mutant Line 2; ± 2 kb from peak center for 3723 less accessible and 2539 more accessible peaks in CHD1L−/− hNPC and corresponding average tag density profiles. Line 1 and Line 2 were combined and the same direction of change for both mutants was selected; Mixed refers to peaks that exhibit opposite changes in Mutant Line 1 compared to Mutant Line 2 and were discarded from the subsequent analyses. (L) Venn diagram showing 74 downregulated genes that are also less accessible in absence of CHD1L. (M) Venn diagram showing 35 upregulated genes that are also more accessible in absence of CHD1L. (N) Chromatin accessibility and level of expression for UNC5D and NRP2 in control and mutant hNPC. |
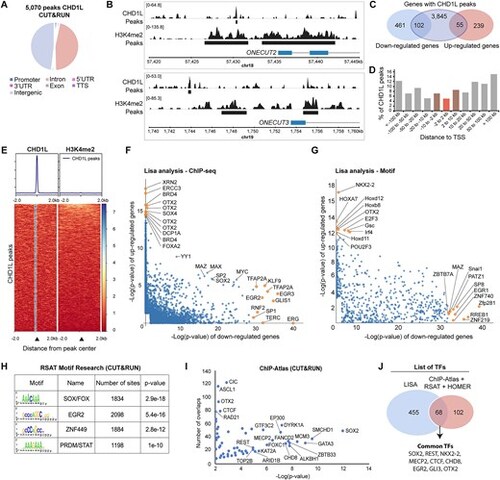
Characterization of CHD1L binding in hNPC. (A) Pie chart of the genomic distribution of CHD1L CUT&RUN peaks in control hNPC. (B) Examples of CHD1L-bound sites located upstream of downregulated genes ONECUT2 and ONECUT3. (C) Venn diagram showing CHD1L-bound genes that are downregulated or upregulated in CHD1L mutant hNPC. (D) CHD1L Peak distribution from TSS. (E) Tag density map of CHD1L and H3K4me2 CUT&RUN peaks, ± 2 kb from the CHD1L peak center and corresponding average tag density profiles. (F, G) Lisa results showed as pairwise scatterplots for comparison of the two gene sets (downregulated and upregulated genes in absence of CHD1L in hNPC) based on TF ChIP-seq and TF motifs respectively. The top 10 TFs are shown in yellow. (H, I) RSAT-based motif enrichment analysis and ChIP-Atlas comparison of CHD1L CUT&RUN data, respectively. (J) Venn diagram showing common TFs predicted by Lisa, ChIP-Atlas, RSAT, and HOMER analyses. |
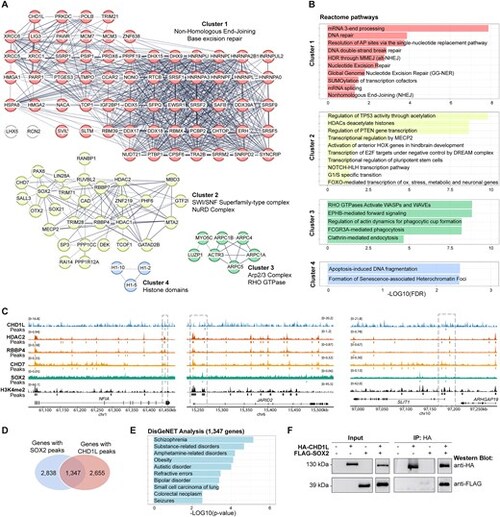
Immunoprecipitation and mass-spectrometry define CHD1L interactome and reveal developmental partners in hNPC. (A) STRING analysis of 104 nuclear proteins co-immunoprecipitated with CHD1L in hNPC extracts. Protein–protein interactions are shown (Protein-Protein interaction (PPI) enrichment P-value < 1e−16) and annotated according to functional clusters: Cluster 1 (63 proteins), Cluster 2 (29 proteins), Cluster 3 (7 proteins), Cluster 4 (3 proteins). (B) Gene ontology analyses showing reactome pathways enriched for each cluster. (C) Representative co-localization of CHD1L, HDAC2 (SRX19212560), RBBP4 (SRX19212562), SOX2 (SRX330107), CHD7 (SRX9795022), and H3K4me2 peaks on neuro-developmental genes (NFIA, JARID2, SLIT1) in human neural cells. (D) Venn diagram of SOX2 target genes (SRX330107) and CHD1L target genes showing an overlap of 1347 genes. (E) DisGeNET analysis of the common 1347 SOX2 and CHD1L target genes showing enrichment in human neurodevelopmental disorders. (F) Representative western blot of CHD1L and SOX2 co-immunoprecipitation in transfected HEK cells. |
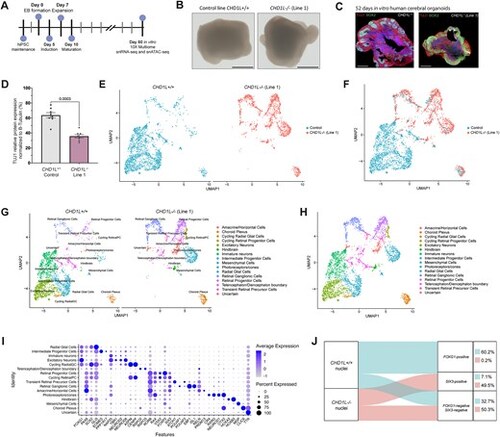
Loss of CHD1L perturbs forebrain cell-fate determination in hCO. (A) Schematic of hCO generation from hiPSC. (B) Pictures of 60 DIV hCO derived from CHD1L+/+ and the two CHD1L−/− cell lines. Scale bars: 1 mm. (C) Immunostaining against TUJ1 (neuronal cytoskeleton marker) and SOX2 (neural progenitor cells) on 52 DIV hCO either CHD1L−/− (Mutant Line 1) or control. Scale bars: 500 μm. (D) Semi-quantitative analysis of TUJ1 protein expression in CHD1L−/− (Mutant Line 1) and control hCO normalized with β-Tubulin. Data shown as mean ± SEM of 8 hCO per condition; representative of N = 2 batches of generated organoids; Student’s t-test. (E) Uniform Manifold Approximation and Projection (UMAP) projection of CHD1L+/+ and CHD1L−/- hCO cells colored by condition. N = 6 organoids per condition, 2385 cells CHD1L+/+ and 1634 cells CHD1L−/− sequenced. (F) UMAP representation of CHD1L+/+ and CHD1L−/− (Mutant Line 1) multiome analysis combined and integrated on the same graph. N = 12 organoids, 4019 cells. (G) UMAP representation of CHD1L+/+ and CHD1L−/− (Mutant Line 1) hCO multiome analysis on the same graph. Clusters based on cell identities are indicated. (H) UMAP representation of CHD1L+/+ and CHD1L−/− (Mutant Line 1) hCO multiome analysis combined and integrated on the same graph. Clusters based on cell identities are indicated. (I) Dot plot representing key cell type markers and their levels of gene expression within cerebral organoids’ cell clusters. Dot size indicates the proportion of cells per cluster expressing the corresponding gene and color is associated to the average expression level of the corresponding gene per cluster. (J) Sankey diagram visualization of the proportion of nuclei positive for either the ventral telencephalic marker FOXG1, or the eye territory marker SIX3 (normalized expression >1) in CHD1L+/+ and CHD1L−/− hCO. Percentage of nuclei is indicated for each category. |
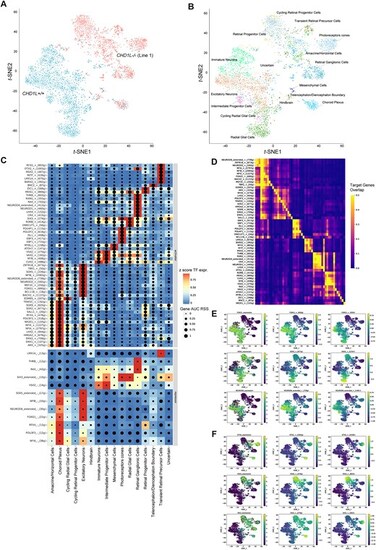
SCENIC + analysis reveals CHD1L function in forebrain cell-fate determination. (A) t-SNE dimensionality reduction of 4019 cells based on gene and target region enrichment scores of eRegulons. Cells are colored according to their genotypes CHD1L+/+ and CHD1L−/− and were analyzed for gene expression and chromatin accessibility in 60-day in vitro hCO. (B) t-SNE dimensionality reduction of organoid cells based on gene and target region enrichment scores of eRegulons. Cells are colored according to their identity. (C) Heatmap/dot-plot showing transcription factor (TF) expression of the eRegulon on a color scale and cell-type specificity (RSS) of the eRegulon on a size scale. Cell types are ordered on the basis of their gene expression similarity. (D) Overlap of target genes of eRegulons. The overlap is divided by the number of target genes of the eRegulon in each row. (E) Representative t-SNE dimensionality reduction of multiome dataset colored based on TF expression, target gene and region activity of eRegulons for telencephalic markers (FOXG1, SOX2, NEUROD6). (F) Representative t-SNE dimensionality reduction of multiome dataset colored based on TF expression, target gene and region activity of eRegulons for retinal markers (OTX2, VSX2, SIX3). AUC, area under the recovery curve; g, gene; r, region; RSS, eRegulon specificity score; TF, transcription factor. |
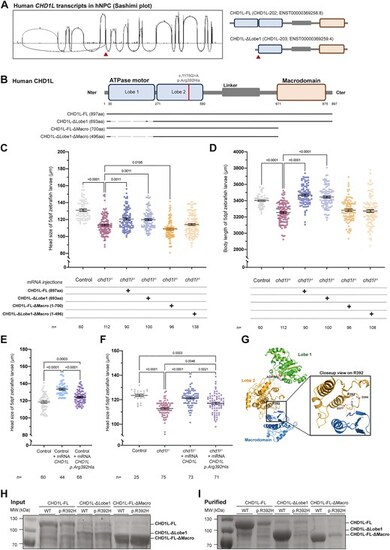
CHD1L function is mediated through its macrodomain and is implicated in neurodevelopmental disorders. (A) Sashimi plot of CHD1L mRNA transcripts expressed in hNPC showing two main isoforms corresponding to CHD1L-202 (ENST00000369258.8) and CHD1L-203 (ENST00000369259.4). (B) Schematic representation of the human protein isoforms of CHD1L including CHD1L-FL (CHD1L-202), CHD1L-ΔLobe1 (CHD1L-203), and two truncated forms of CHD1L (CHD1L-FL-ΔMacro and CHD1L-ΔLobe1-ΔMacro). The homozygous variant p.Arg392His is shown on the protein. (C) Dot plot showing the distance between the eyes (head size) of 5 dpf control larvae and larvae injected with mRNA for each of the two isoforms and the two truncated forms of CHD1L. Data shown as mean ± SEM of triplicate batches; Kruskal–Wallis test performed between chd1l−/- alone versus all the other conditions. (D) Dot plot showing the body length of 5 dpf control larvae and larvae injected with mRNA for each of the two isoforms and the two truncated forms of CHD1L. Data shown as mean ± SEM of triplicate batches; ordinary one-way ANOVA performed between chd1l−/- alone versus all the other conditions to validate phenotypic rescue. (E) Dot plot showing the distance between the eyes (head size) of 5 dpf control larvae or larvae injected with human CHD1L-FL mRNA either WT or carrying the mutation p.Arg392His. Data shown as mean ± SEM of triplicate batches; ordinary one-way ANOVA. (F) Dot plot showing the distance between the eyes (head size) of 5 dpf control, noninjected chd1l mutant larvae and chd1l mutant larvae injected with the human CHD1L-FL mRNA either WT or carrying the mutation p.Arg392His. Data shown as mean ± SEM of triplicate batches; ordinary one-way ANOVA. (G) Ribbon representation of the structure of the self-inhibited form of CHD1L (PDB entry 7epu) in full (left panel) and with a closeup on the region harboring Arg392 residue (boxed right panel). Arg392 structures a specific region of CHD1L ATPase lobe 2 (orange) by interacting with main chain carbonyls and aspartate side chains. This region is key in interacting with the CHD1L macrodomain (blue) in the inhibited form. (H) Total protein expression levels in E. coli of the three constructs used in this study. No significant changes are observed between the WT and p.Arg392His constructs. (I) Levels of the soluble CHD1L constructs from panel (H). The p.Arg392His mutation causes a major decrease of the solubility of CHD1L constructs, irrespective of the construct considered. |

ZFIN is incorporating published figure images and captions as part of an ongoing project. Figures from some publications have not yet been curated, or are not available for display because of copyright restrictions. |