FIGURE SUMMARY
Title

CDKL1 variants affecting ciliary formation predispose to thoracic aortic aneurysm and dissection

Authors
Nauth, T., Philipp, M., Renner, S., Burkhalter, M.D., Schüler, H., Saygi, C., Händler, K., Siebels, B., Busch, A., Mair, T., Rickassel, V., Deden, S., Hoffer, K., Olfe, J., Mir, T.S., von Kodolitsch, Y., Girdauskas, E., Rybczynski, M., Kriegs, M., Voß, H., Sauvigny, T., Spielmann, M., Alawi, M., Krasemann, S., Kubisch, C., Demal, T.J., Rosenberger, G.
Source
Full text @ Journal of Clin. Invest.

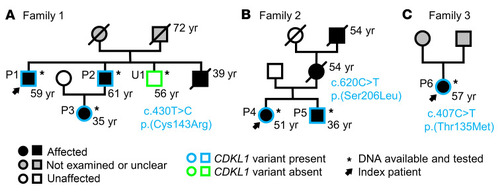
Family pedigrees.

The respective identified CDKL1 variant and current age (in years) is given. (A) Family 1. Patients P1, P2, and P3 with a TAAD spectrum disorder were used for the identification of CDKL1 as candidate disease gene. U1, unaffected brother of the index. (B) Family 2. Patients P4 and P5 with Marfan syndrome–like features. (C) Family 3. Patient P6 with aortic dissection.

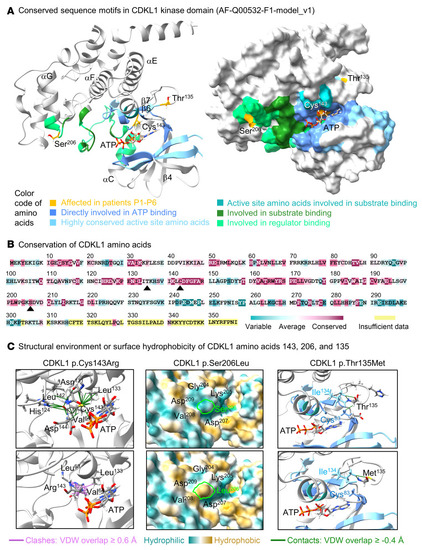
Structural and physicochemical impact of CDKL1 amino acid changes.

(A) Molecular position of CDKL1 amino acids Cys143, Ser206, and Thr135 in relation to conserved sequence motifs and accessible surfaces. CDKL1 amino acids 1–303 are shown (AlphaFold AF-Q00532-F1-model_v4; AlphaFill AF-Q00532-F1-model_v1). Different colors in the ribbon representation (left model) and on the protein surface (right model) indicate conserved sequence motifs in the protein kinase domain of CDKL1 (amino acids 5–288). Secondary structure elements including β4, β6, and β7 strands as well as αC, αE, αF, and αG helices are indicated. (B) Conservation of CDKL1. Conservation was determined between 150 sequences among various species and visualized using the ConSurf server. Conserved amino acids are highlighted in maroon and variable residues in cyan. Cys143, Ser206, and Thr135 are marked with arrowheads. (C) Structural or physicochemical consequences of CDKL1 amino acid changes. Ribbon representations show spatial positions of CDKL1 wild-type amino acids Cys143 and Thr135 (top models) and exchanged amino acids Arg143 and Met135 (bottom models) as well as neighboring amino acids and phosphate donor ATP (all as sticks). Van der Waals (VDW) overlaps ≥0.4 Å (i.e., contacts) are shown as green lines; VDW overlaps ≥0.6 Å (i.e., clashes) are indicated by magenta lines. Side chains are colored by element (hydrogen: white; carbon: gray; oxygen: red; nitrogen: blue; sulfur: yellow; phosphorus: orange). In the ribbon representations for the p.Thr135Met change, amino acids involved in ATP positioning and protein catalysis are indicated by dark blue and light blue, respectively. Protein surface models show surface hydrophobicity of wild-type amino acid Ser206 (top model) and replaced amino acid Leu206 (bottom model), both within the putative Gly-Lys-Ser-Asp-Val-Asp protein binding motif. The color code ranges from cyan for the most hydrophilic residues to tan for the most hydrophobic residues. Comprehensive models are shown in Supplemental Figures 2–4.

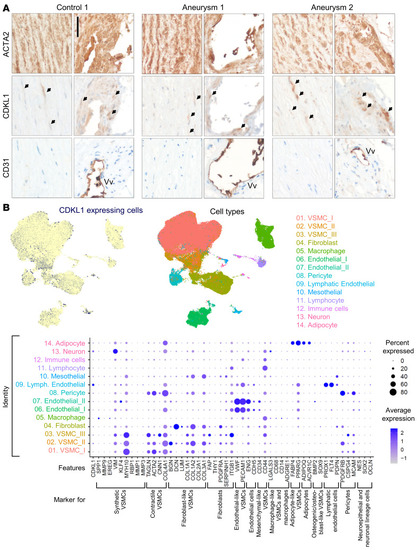
CDKL1 is expressed in VSMCs of normal and diseased aortic tissue.

(A) Immunohistological analysis of CDKL1 expression in aortic wall tissue. Consecutive sections of formalin-fixed paraffin-embedded human aorta tissue from a control individual (control 1) and 2 patients with aortic aneurysms (aneurysm 1 and aneurysm 2) were immunostained for VSMC marker protein ACTA2 (smooth muscle actin), CDKL1 (antibody 1 [AB1; see Supplemental Data: Results]; 1:300), and the vascular endothelial marker CD31 using specific primary antibodies and horseradish peroxidase–conjugated (brown) secondary antibodies. Specimens were counterstained with hematoxylin (nuclei, blue). Representative pictures are shown. Note that CDKL1 is colocalizing with ACTA2-positive cells. Arrows indicate cells with stronger CDKL1 expression. Vv, vasa vasorum. Scale bar: 50 μm. (B) Reanalysis of combined publicly available human aortic single-cell RNA-Seq datasets (28, 29). Filtered and annotated data were merged and integrated using Harmony. Top left panel: Feature plot of CDKL1 expression in combined dataset. Each cell in the dataset is represented by a dot in the uniform manifold approximation and projection (UMAP) space. Cells with a CDKL1 expression above 0 are colored in blue; cells with no detected expression of CDKL1 are colored in yellow. Top right panel: UMAP representation of the annotation of the combined dataset. Annotation was copied and combined from original publications (28, 29). Bottom panel: Dot plot of marker genes confirming cell identity. Gene markers for specific cell types were selected from literature (2527).

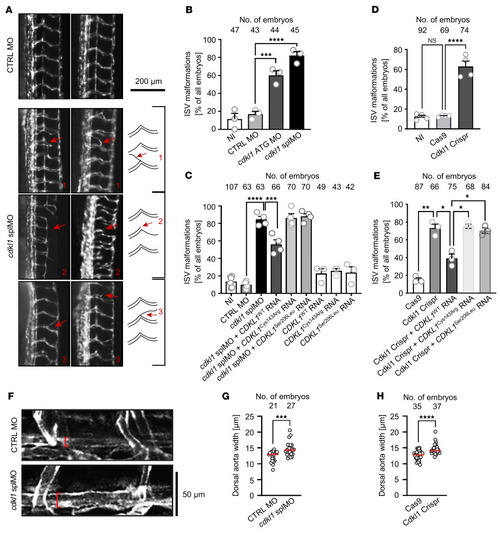
ISV malformation and aortic dilation in zebrafish cdkl1 morphants and crispants.

(A) ISV malformations in zebrafish embryos. Representative fluorescence images are shown for each phenotype; dorsal to the right. Cartoon illustrates aberrantly formed ISVs in 48-hpf fli-GFP embryos. (B) Quantification of ISV formation defects. (C) Coinjection of RNA encoding CDKL1WT rescued ISV defects upon MO-induced Cdkl1 knockdown, while variants encoding CDKL1Cys143Arg and CDKL1Ser206Leu are unable to rescue ISV malformations. Overexpression of CDKL1WT or its variants did not induce ISV defects. (D) Cdkl1 crispants (Cdkl1 Crispr) display ISV defects more often than do non-injected (NI) embryos or embryos injected with Cas9 only. Single ribonucleoprotein complexes including 2 guide RNAs (targeting Cdkl1 exons 6 and 7) and Cas9 were injected into the first cell of fertilized zebrafish eggs; as control, eggs were injected with Cas9 only. 1-way ANOVA with Šidák’s multiple-comparison tests were applied (B, C, and D). Bar graphs show means + SEM; n = 3 (B), n = 3–6 (C), and n = 4 (D) experiments. NS, P = 0.9806; ***P ≤ 0.001, ****P ≤ 0.0001. (E) Coinjection of RNA encoding CDKL1WT rescued ISV defects upon CRISPR/Cas–mediated Cdkl1 knockdown, while neither mutant variant did so. n = 3 experiments. *P ≤ 0.05, **P = 0.0040, Brown-Forsythe and Welch’s ANOVA test with Dunnett’s T3 multiple-comparison test. (F) Cdkl1 morphants display aortic dilation. Fli-GFP zebrafish embryos were injected with control (CTRL) MO or Cdkl1 splMO. Representative image of the dorsal aorta in embryos 4 days post-fertilization. Red bracket indicates width of the aorta. (G) Quantification of aortic dilation. (H) Cdkl1 crispants display aortic dilation. Single ribonucleoprotein complexes including 2 guide RNAs (targeting Cdkl1 exons 6 and 7) and Cas9 were injected into the first cell of fertilized zebrafish eggs; as control, eggs were injected with Cas9 only. 2-tailed Mann-Whitney test was applied; n = 3 experiments; red lines show medians; ***P = 0.0003, ****P < 0.0001 (G and H). Circles in the graphs indicate individual experiments, and numbers of embryos analyzed are given (BE, G, and H).

CDKL1 variants interfere with kinase function.

(A and B) In vitro kinase assays. HeLa (A) or HEK293T (B) cells were transiently transfected with CDKL1 and IME2 constructs or empty vectors (HAcontrol and EGFPcontrol). Fusion proteins were immunoprecipitated and subjected to kinase assays using peptide substrate RPRSPGARR and the ADP-Glo kinase assay (Promega). Luminescence intensities of individual measuring points were normalized to the entire luminescence signal of an experiment and to the amount of immunoprecipitated protein (n = 7, A; n = 4, B). Medians (50th percentiles, lines in boxes) as well as 0th, 25th, 75th, and 100th percentiles are given in the box plots. Small aliquots were removed from precipitates and subjected to immunoblotting using anti-HA (A) and anti-GFP (B) antibodies; representative blots are shown. *P ≤ 0.05, **P ≤ 0.01, ***P ≤ 0.001, 1-way ANOVA with Dunnett’s post hoc multiple-comparison test. (C) CDKL1 serine/threonine phosphorylation profiling. EGFP-tagged CDKL1 variants were expressed in HEK293T cells, purified using GFP-Trap (ChromoTek), and applied to STK-PamChip arrays (PamGene). Seventy-one peptides passed quality control. The heatmap displays average log2-transformed signal intensities for indicated CDKL1 variants. The signals were sorted from high (red) to low (blue) intensity that corresponds to phosphorylation levels. To visualize overall sample variance and group differences, peptide phosphorylation and overall kinase activity are shown in box plot representation. (D) Peptide substrates with significantly changed phosphorylation. The heatmap shows significantly differentially phosphorylated peptides between samples treated with disease-associated CDKL1 variants versus CDKL1WT. The effects of CDKL1 variants are log ratios [log2(disease-associated CDKL1 variant)/log2(CDKL1WT)]. Blue and red indicate reduced and increased phosphorylation, respectively. Peptides that did not pass the significance threshold (P < 0.05, disease-associated CDKL1 variant vs. CDKL1WT) are black. Peptide numbers correspond to those in Supplemental Table 2, where details on the substrates are also described.

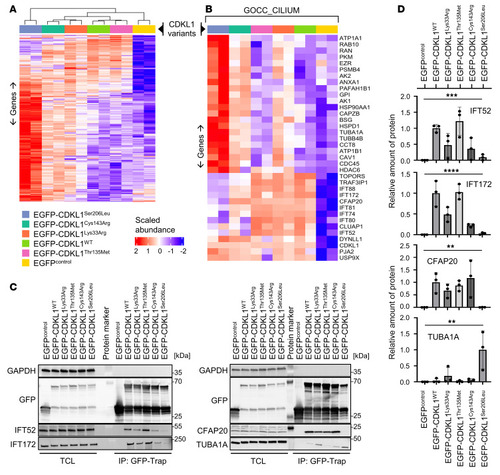
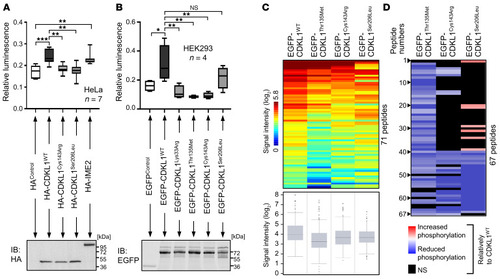
Disease-associated CDKL1 variants show different protein-protein interaction profiles.

EGFP-tagged CDKL1 protein variants were expressed in HEK293T cells, purified by GFP-Trap, and subjected to liquid chromatography–tandem mass spectrometry analysis. Experimental duplicates were performed for all conditions. Protein abundances were normalized based on GFP protein peptide abundances. (A and B) Heatmaps: Pearson correlation–based hierarchical clustering of EGFP-vector, CDKL1WT, CDKL1Lys33Arg, CDKL1Thr135Met, CDKL1Cys143Arg, and CDKL1Ser206Leu samples with average linkage, based on 626 ANOVA-significant proteins (A) and on 36 cilium proteins, assigned to the GOCC gene set Cilium (B) between all analyzed phenotypes (adjusted P value < 0.05). Normalized protein abundances were scaled before clustering for visual purposes. Relative protein abundance is coded by colors from red (high abundance) to blue (low abundance). (C and D) Validation of differentially affected protein-protein interactions. Total cell lysates (TCL) of HEK293T cells expressing EGFP-tagged CDKL1 protein variants or EGFP (control) were subjected to immunoprecipitation (IP) using GFP-Trap beads. CDKL1 expression and precipitation efficiencies were determined by anti-GFP immunoblotting. Coprecipitation and input levels of endogenous IFT52, IFT172, CFAP20, and TUBA1A were assessed by immunoblotting using specific primary antibodies; GAPDH was used as loading control (C). The graph shows mean relative amounts of coprecipitated IFT52, IFT172, CFAP20, and TUBA1A normalized to precipitated GFP (D). The mean of experiments for CDKL1WT (IFT52, IFT172, CFAP20) and CDKL1Ser206Leu (TUBA1A) was set to 1. **P ≤ 0.01, ***P ≤ 0.001, ****P ≤ 0.0001, 1-way ANOVA. n = 3 experiments.

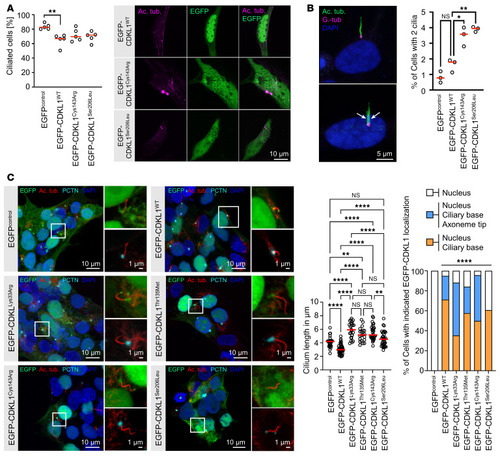
Consequences of CDKL1 variants for ciliary biology.

(A) Expression of CDKL1 variants affects primary cilia formation. EGFP-CDKL1 variants were transiently expressed in RPE-1 cells (green), serum-starved to induce ciliation, and stained for the axoneme of primary cilia with anti–acetylated tubulin (Ac. tub., magenta). Scale bar: 10 μm. n = 5 experiments with more than 100 cells per condition and experiment counted. **P = 0.0083, Kruskal-Wallis test with Dunn’s multiple-comparison post-test. (B) Expression of disease-associated CDKL1 variants increases number of bi-ciliated RPE-1 cells. EGFP-CDKL1 variants were transiently expressed in RPE-1 cells (green) and stained for the axoneme with anti–acetylated tubulin (Ac. tub., green) and for the basal body with anti–γ-tubulin (G.-tub., magenta) antibodies. Scale bar: 5 μm. n = 3 experiments with 211–441 ciliated cells counted. *P = 0.0309, **P = 0.0070, Brown-Forsythe and Welch’s ANOVA test with Dunnett’s T3 multiple-comparison test. (C) CDKL1 variants localize at the basal body (and tip) of the primary cilium and affect cilia length in HEK293T cells. EGFP-CDKL1 variants were transiently expressed in HEK293T cells (green). Cells were stained for the axoneme of primary cilia with anti–acetylated tubulin (red) and for the basal body with anti-pericentrin (cyan) antibodies. Nuclei were stained with DAPI (blue). Shown are representative images of CDKL1-expressing cells with primary cilia; further images are given in Supplemental Figure 11. Scale bars: 10 μm, and 1 μm in close-up images. Quantification of cilium length: n = 3 experiments with ≥20 cilia per condition measured; median (red bars) and individual experiments (circles) are indicated. **P < 0.01, ****P < 0.0001, Brown-Forsythe and Bartlett’s ANOVA test with Tukey’s multiple-comparison test. Quantification of CDKL1 localization: Stacked bar graphs summarize 3 experiments with ≥17 cilia per condition analyzed. ****P < 0.0001, Fisher’s exact test. All images (AC) were acquired with a confocal microscope.

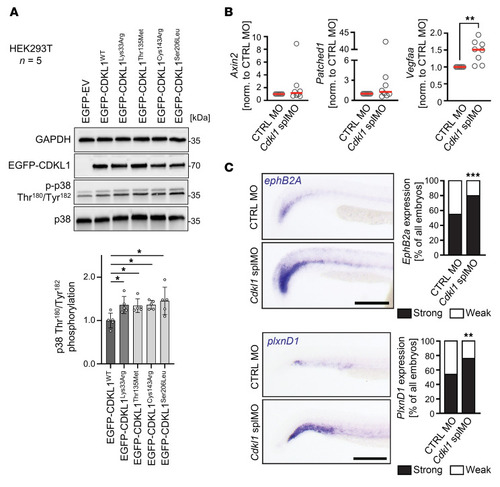
CDKL1 function in cell signaling.

(A) CDKL1 variants increase signaling via p38 (MAPK8). Total lysates of HEK293T cells transiently expressing CDKL1WT, CDKL1Thr135Met, CDKL1Cys143Arg, or CDKL1Ser206Leu were cultured under basal conditions (DMEM containing 10% serum), lysed, and subjected to immunoblotting as indicated. Cells expressing kinase-dead CDKL1Lys33Arg and cells transfected with empty vector (EV) were used as controls. GAPDH was used as loading control. Representative immunoblots from 5 independent experiments (n = 5) are given. Graph shows means (± SD) of the relative phosphorylation of p38 (at Thr180 and Tyr182) normalized to amounts of total p38 as well as to GAPDH. Phosphorylation levels in cells expressing CDKL1 mutants are relative to those in CDKL1WT cells. One-way ANOVA with Tukey’s multiple-comparison test was used. *P ≤ 0.05, **P ≤ 0.01. (B) Knockdown of Cdkl1 induces Vegfaa expression. Quantitative PCR analysis was performed on total RNA of 24 hpf zebrafish embryos. Graphs show amounts of axin2, patched1, and vegfaa transcripts in Cdkl1 splMO relative to CTRL MO–treated embryos. n = 8 experiments; mean values (red bars) and individual experiments (circles) are indicated. **P = 0.07, 2-tailed Wilcoxon’s test. (C) Expression of the arterial marker ephrin B2a (ephB2a) and of plexin D1 (plxnD1) is stronger in Cdkl1 morphants than in control-injected embryos. Spatial expression was determined by in situ hybridization. Stacked bar graphs summarize 3 experiments with 82 (CTRL MO) and 85 embryos (Cdkl1 splMO) for ephB2a and 3 experiments with 63 (CTRL MO) and 42 embryos (Cdkl1 splMO) for plxnD1. **P = 0.0018, ***P = 0.0003, 2-sided Fisher’s exact test. All experiments were done at 24 hpf. Scale bars: 200 μm.

EXPRESSION / LABELING:
Genes:
Fish:
Knockdown Reagent:
Anatomical Term:
Stage: Prim-5
PHENOTYPE:
Fish:
Knockdown Reagent:
Observed In:
Stage: Prim-5

ZFIN is incorporating published figure images and captions as part of an ongoing project. Figures from some publications have not yet been curated, or are not available for display because of copyright restrictions.

EXPRESSION / LABELING:
Gene:
Fish:
Anatomical Terms:
Stage Range: 5-9 somites to Prim-5
Acknowledgments
This image is the copyrighted work of the attributed author or publisher, and ZFIN has permission only to display this image to its users. Additional permissions should be obtained from the applicable author or publisher of the image. Full text @ Journal of Clin. Invest.