
- Title
-
Cohesin protein Smc3 influences kinocilial structure and function
- Authors
- Mensching, F.M., Banoukh, N., Iovine, M.K.
- Source
- Full text @ Biol. Open
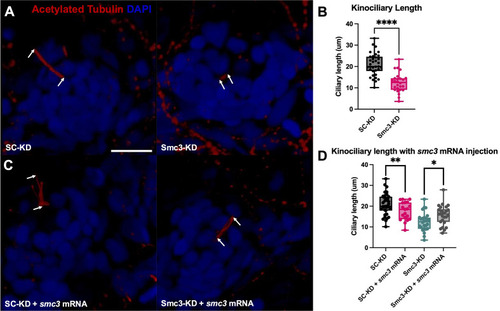
EXPRESSION / LABELING:
PHENOTYPE:
|
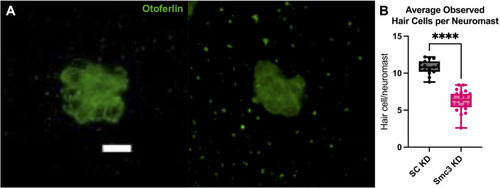
EXPRESSION / LABELING:
PHENOTYPE:
|
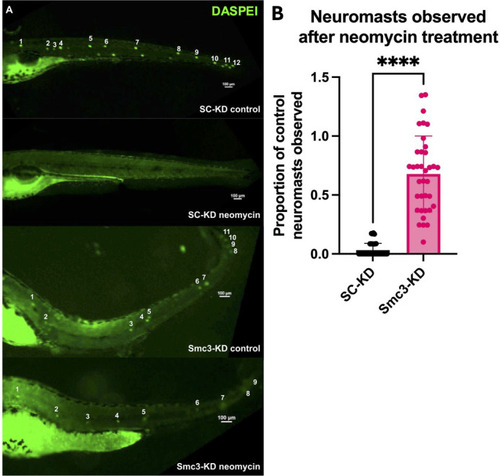
PHENOTYPE:
|
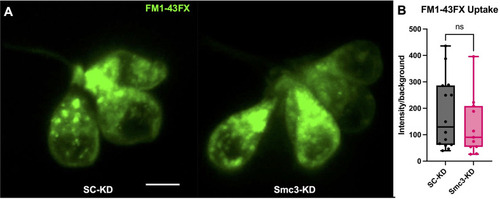
PHENOTYPE:
|