FIGURE
            Fig. 7
- ID
 - ZDB-FIG-110712-77
 - Publication
 - Gregory-Evans et al., 2011 - Gene-specific differential response to anti-apoptotic therapies in zebrafish models of ocular coloboma
 - Other Figures
 - All Figure Page
 - Back to All Figure Page


                        Fig. 7


| 


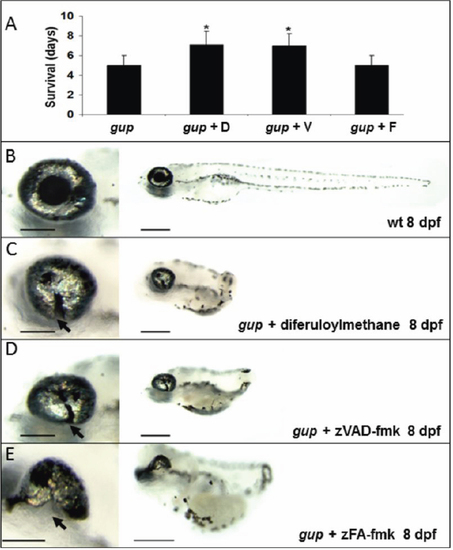
 Effect of caspase inhibition on survival and optic fissure closure. A: Mean survival of gup mutant embryos with no treatment or with either diferuloylmethane, zVAD-fmk or control inhibitor zFA-fmk. n=30 for each group, mean±SEM (*p<0.001). B: Wildtype (wt) larval phenotype at 8 dpf. C: Phenotype of gup mutants treated with 5 μM diferuloylmethane. D: Phenotype of gup mutant embryos treated with 300 μM zVAD-fmk. E: Phenotype of gup mutants treated with 300 μM zFA-fmk. Arrows indicate the position of the coloboma. Size bar in left panels=200 μm; size bar in right panels=500 μm.  | 


                        Expression Data


                        Expression Detail


                        Antibody Labeling


                        Phenotype Data


    | Fish: | |
|---|---|
| Conditions: | |
| Observed In: | |
| Stage Range: | Day 5 to Days 7-13 | 
                
                    
                        Phenotype Detail


                        Acknowledgments


This image is the copyrighted work of the attributed author or publisher, and
ZFIN has permission only to display this image to its users.
Additional permissions should be obtained from the applicable author or publisher of the image.