
Fig. 4
- ID
- ZDB-FIG-150629-9
- Publication
- Rossi et al., 2015 - The SLC7A7 Transporter Identifies Microglial Precursors prior to Entry into the Brain
- Other Figures
- All Figure Page
- Back to All Figure Page
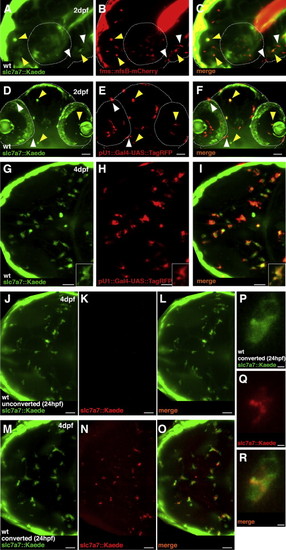
Slc7a7+ Cells Give Rise to Microglia in the Brain (A–C) Lateral view shows a representative slc7a7::Kaede;fms::nfsB-mCherry embryo at 2 days post fertilization; slc7a7+ cells (A, green, slc7a7::Kaede), macrophages (B, red, fms::nfsB-mCherry), and overlay (C) are shown. Few cells are both fms+ and slc7a7+ (yellow arrowheads). White arrowheads indicate fms+ cells only. (D–F) Frontal view shows a representative slc7a7::Kaede;pU.1::TagRFP embryo at 2 days post fertilization. Slc7a7+ cells (D, green, slc7a7::Kaede), leukocytes (E, red, pU.1::TagRFP), and overlay (F) are shown. Few cells are both pU.1+ and slc7a7+ (yellow arrowheads). White arrowheads indicate pU.1+ cells only. (G–I) Dorsal view shows a slc7a7::Kaede;pU.1::TagRFP embryo at 4 days post fertilization. Microglia are both slc7a7+(G) and pU.1+ (H), with overlay (I) and a representative microglia (inset) shown. (J–O) Dorsal view shows a 4-day-post-fertilization slc7a7::Kaede embryo not photoconverted (J–L) and photoconverted at 24 hpf (M–O) (Kaede green, J and M; Kaede red, K and N; overlay, L and O). (P–R) Representative example of a photoconverted microglia is shown. Scale bars for all images, 25 µm. See also Figure S4. |
| Genes: | |
|---|---|
| Fish: | |
| Anatomical Terms: | |
| Stage Range: | Long-pec to Day 4 |