FIGURE
            Fig. S4
                
                    
                        Fig. S4


| 


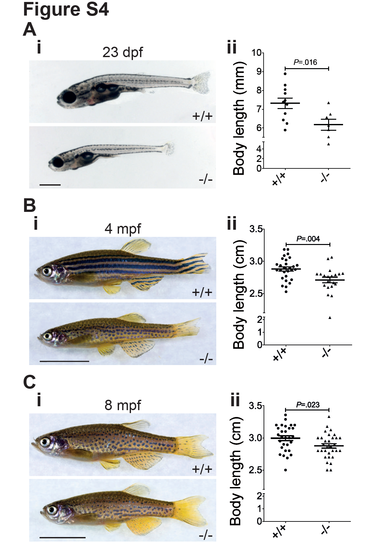
 Rad51 mutant fish are smaller than their wild type siblings. (A) Representative images of mutant and wt fish at 23 dpf (i). (ii) Graph showing difference in size between the genotypes. Two-sided Student’s t-test (P=.0016), n+/+=11, n-/-=7. Scale bar=1 mm. (B) Comparison of mutant and wild type fish at 4 mpf. Two-sided Student’s t-test (P=.004), n+/+=28, n-/-=19. Scale bar=1 cm. (C) (i) Representative images of mutant and wt fish at 8 mpf. (ii) Graph showing difference in size between the genotypes. Two-sided Student’s t-test (P=.023), n+/+=29, n-/-=31. Scale bar=1 cm. Bars represent mean +/- SEM in all graphs.  | 


                        Expression Data


                        Expression Detail


                        Antibody Labeling


                        Phenotype Data


    | Fish: | |
|---|---|
| Observed In: | |
| Stage Range: | Days 21-29 to Adult | 
                
                    
                        Phenotype Detail


                        Acknowledgments


This image is the copyrighted work of the attributed author or publisher, and
ZFIN has permission only to display this image to its users.
Additional permissions should be obtained from the applicable author or publisher of the image.
      Full text @ Proc. Natl. Acad. Sci. USA