|
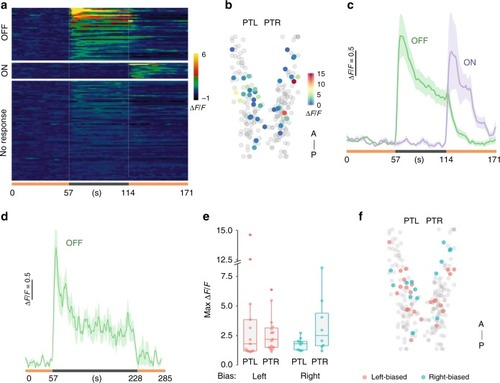
Neurons in the posterior tuberculum respond to changes in illumination.a Raster plot of mean calcium responses (mean of three trials) from GCaMP6s expressing PT neurons. Color scale denotes standardized change in fluorescence intensity (ΔF/F). Illumination conditions as indicated on the X axis (light ON, orange; dark, gray). Only a subset of no-response neurons are included. b Location of light OFF-responsive neurons in the rostral PT. Scale bar indicates fluorescence (ΔF/F) change over baseline. c Mean and standard error for response of light OFF- (green, N = 46) and light ON- (purple, N = 14) responsive neurons. d Mean and standard error for response of light OFF- (green, N = 8) responsive neurons during the 3-min dark period. e Peak change in fluorescence for neurons that respond to light OFF in the left (PTL) and right (PTR) PT for larvae classified as left (red) and right (blue) motor-biased. f Location of light OFF-responsive neurons within the PT for larvae behaviorally identified as left- (red) or right- (blue) biased. Error bars represent standard error of the mean. Box plots show median and quartiles with whiskers indicating 10–90%. Source data are provided as a Source Data file.
|