
Fig. 5
- ID
- ZDB-FIG-210611-33
- Publication
- Griffin et al., 2021 - Phenotypic analysis of catastrophic childhood epilepsy genes
- Other Figures
- All Figure Page
- Back to All Figure Page
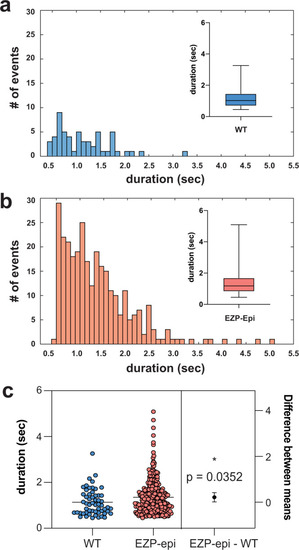
Histograms depict number and duration of ictal events measured using a custom MATLAB-based program for |
| Fish: | |
|---|---|
| Observed In: | |
| Stage: | Day 5 |