
Figure 2
- ID
- ZDB-FIG-210927-25
- Publication
- Pulgar et al., 2021 - Apical contacts stemming from incomplete delamination guide progenitor cell allocation through a dragging mechanism
- Other Figures
- All Figure Page
- Back to All Figure Page
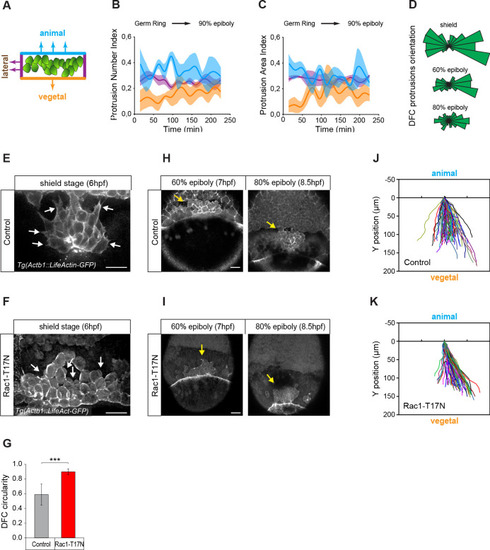
(A) Schematic representation of the DFC cluster showing how cell protrusions extending from the vegetal (orange), lateral (purple), and animal (light blue) edges of the cluster were quantified in Tg(actb1::lifeactin-RFP) embryos to build the plots of (B) and (C). (B) Kinetic of normalised DFC protrusion number in living embryos (n = 3 embryos). (C) Kinetic of normalised DFC protrusion area in living embryos (n = 3 embryos). (D) Circular distribution plots of DFC protrusion orientation at different developmental stages obtained from fixed Tg(sox17::utrn-GFP) embryos (n = 11, 10, and 9 embryos for shield, 60% epiboly and 80% epiboly, respectively). (E, F) Dorsal views of confocal z-stack maximum projections showing the protrusions formed in DFCs (white arrows) from representative living Tg(actb1::lifeactin-RFP) embryos at shield stage in control (E) and Rac1-T17N injected (F) conditions. Scale bar, 20 µm. (G) Plot of circularity index of DFC protrusions in control and Rac1-T17N injected embryos, expressed as means ± s.d. ***p ≤ 0.001 (n = 42 cells from two control embryos and 62 cells from 3 Rac1-T17N embryos). (H, I) Dorsal views of confocal z-stack maximum projections showing the vegetal movement of the DFC cluster (yellow arrows) from representative living Tg(actb1:lifeactin-RFP) embryos from 60% to 80% epiboly stages in control (H) and Rac1-T17N injected (I) conditions. Scale bar, 20 µm. (J, K) Tracking plots of DFC movement in control (J) and Rac1-T17N injected (K) conditions, showing the directional movement of DFCs (n = 2 embryos for control and 3 embryos for Rac1-T17N injected conditions). Animal is to the top in all image panels. Source data for all plots are provided in Figure 2—source data 1.
|