
Figure 5
- ID
- ZDB-FIG-230331-23
- Publication
- Buglak et al., 2023 - Nuclear SUN1 stabilizes endothelial cell junctions via microtubules to regulate blood vessel formation
- Other Figures
- All Figure Page
- Back to All Figure Page
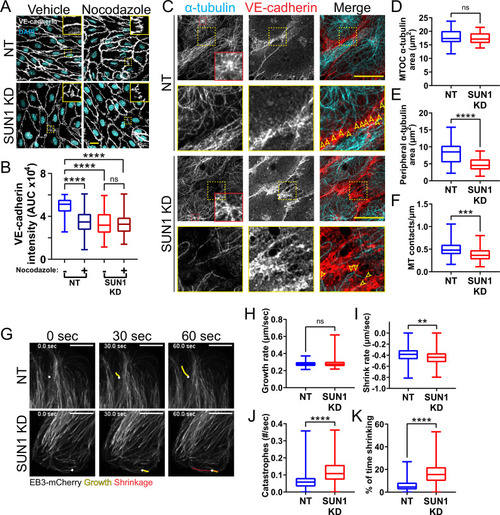
(A) Representative images of human umbilical vein endothelial cells (HUVEC) with indicated siRNAs and indicated treatments. Endothelial cells were stained for DAPI (cyan, DNA) and VE-cadherin (white, junctions). Insets show junctions. Scale bar, 20 µm. (B) Quantification of VE-cadherin line scans for treatments shown in (A). n=106 junctions (non-targeting [NT], vehicle), 101 junctions (NT, Nocodazole), 105 junctions (SUN1 knockdown [KD], vehicle), and 96 junctions (SUN1 KD, Nocodazole) compiled from three replicates. ns, not significant; ****, p<0.0001 by two-way ANOVA with Tukey’s multiple comparisons test. (C) Representative images of HUVEC with indicated siRNAs. Endothelial cells were stained for α-tubulin (cyan, microtubules) and VE-cadherin (red, junctions). Red insets show α-tubulin at the MTOC (microtubule organizing center), yellow insets show α-tubulin contacts at junctions. Arrows denote contact sites. Scale bar, 20 µm. (D) Quantification of α-tubulin area at the MTOC shown in (C). n=19 cells (NT) and 10 cells (SUN1 KD) compiled from three replicates. ns, not significant by Student’s two-tailed unpaired t-test. (E) Quantification of peripheral α-tubulin area shown in (C). n=39 cells (NT) and 46 cells (SUN1 KD) compiled from three replicates. ****, p<0.0001 by Student’s two-tailed unpaired t-test. (F) Quantification of contacts between α-tubulin and VE-cadherin shown in (C). n=75 junctions (NT) and 48 junctions (SUN1 KD) compiled from three replicates. ***, p<0.001 by Student’s two-tailed unpaired t-test. (G) Stills from Video 5 and Video 6 showing microtubule growth in EB3-mCherry labeled HUVEC. White dot indicates start of track. Yellow line indicates growth, red line indicates shrinkage. Scale bar, 10 µm. (H) Quantification of microtubule growth rate from EB3-mCherry microtubule tracking. N=120 microtubules (12 cells, NT) and 117 microtubules (12 cells, SUN1 KD) compiled from two replicates. ns, not significant by Student’s two-tailed unpaired t-test. (I) Quantification of microtubule shrink rate from EB3-mCherry microtubule tracking. n=120 microtubules (12 cells, NT) and 117 microtubules (12 cells, SUN1 KD) compiled from two replicates. **, p<0.01 by Student’s two-tailed unpaired t-test. (J) Quantification of catastrophe rate from EB3-mCherry microtubule tracking. n=120 microtubules (12 cells, NT) and 117 microtubules (12 cells, SUN1 KD) compiled from two replicates. ****, p<0.0001 by Student’s two-tailed unpaired t-test. (K) Quantification of percent of time spent shrinking from EB3-mCherry microtubule tracking. n=120 microtubules (12 cells, NT) and 117 microtubules (12 cells, SUN1 KD) compiled from two replicates. ****, p<0.0001 by Student’s two-tailed unpaired t-test. For all graphs, boxes represent the upper quartile, lower quartile, and median; whiskers represent the minimum and maximum values.
|