
Fig. 2
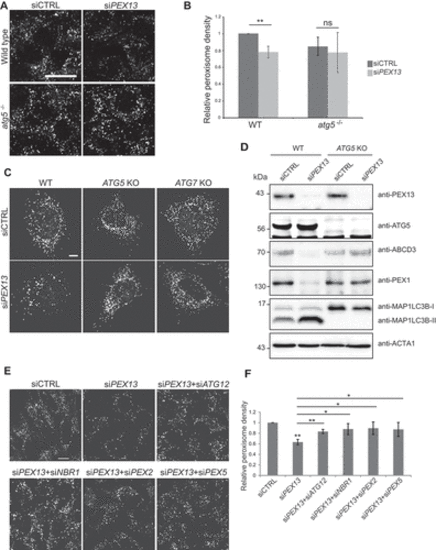
PEX13-mediated peroxisome loss is an autophagic process. (A) Wild type and atg5−/− mouse embryonic fibroblasts (MEFs), transfected with control siRNA (siCTRL) or siPEX13, fixed and immunostained for endogenous ABCD3. (B) Graph of ABCD3 density from images in (A) (n = 3; 30 cells/trial). Error bars represent standard deviation. (C) Wild type, ATG5 knockout and ATG7 knockout HeLa cells stained for endogenous ABCD3. (D) Immunoblot analysis of wild type and ATG5 knockout HeLa cells treated with either siCTRL or siPEX13, probed for the indicated proteins. (E) HeLa cells transfected with non-targeting siRNA (siCTRL) or siPEX13 alone, or siPEX13 co-treated with siATG12, siNBR1, siPEX2 or siPEX5, fixed and immunostained for endogenous ABCD3. (F) Graph of ABCD3 density from images in (E) (n = 3; 30 cells/trial). Error bars represent standard deviation. Asterisks denote p-values: *p < 0.05, **p < 0.01. Scale bars: 25 μm (A and E), 10 μm (C). The contrast of the panels in 2C and 2D appears to be off. Is there a way to correct this? our orginial image does not look like this. Can this be corrected? I can send another imaging if required. |