|
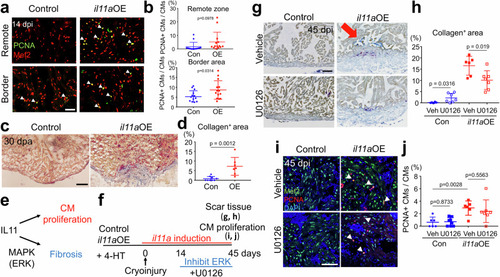
Combinatorial treatment enables to harness the regenerative potential of il11a in injured hearts. a Representative cardiac section images of 14 dpi control and il11aOE hearts stained with Mef2 (red) and PCNA (green). Cryoinjury was performed one day after administering four daily injections of 4-HT. Arrowheads indicate proliferative CMs. b The percentage of PCNA+ CMs in the remote and border zone from Con and il11aOE at 14 dpi. Biological replicates = 14 for control and il11aOE. c Representative AFOG staining images of control and il11aOE hearts at 30 dpa. d Quantification of collagen+ area in the ventricle of control Con and il11aOE at 30 dpa. Biological replicates = 7 and 9 for control and il11aOE, respectively. e Dual roles of il11a in injured hearts. il11a promotes CM proliferation while inducing fibrosis via Extracellular signal-regulated kinase (ERK) activity. f Experimental scheme to harness the regenerative potential of il11a while mitigating fibrosis by treating U0126, an ERK inhibitor, starting at 14 dpi. g Representative AFOG staining images of vehicle (Veh, 0.1% DMSO) or U0126 (10 µM) treated hearts from control and il11aOE. Hearts were collected at 45 dpi/55 dpt. The arrow indicates the presence of scar tissue near the injury site in Veh-treated il11aOE hearts. h Quantification of scar area in the ventricles of Veh or U0126-treated control and il11aOE hearts. Biological replicates = 6, 7, 6, and 7 for control_DMSO, control_U0126, il11aOE_DMSO, and il11aOE_U0126, respectively. i Representative cardiac section images of Veh- or U0126-treated control and il11aOE hearts stained with Mef2 (green) and PCNA (red) at 45 dpi. Arrowheads indicate proliferative CMs. j The percentage of PCNA+ CMs in the ventricles of Veh or U0126-treated control and il11aOE hearts at 45 dpi. Biological replicates = 6, 7, 6, and 7 for control_DMSO, control_U0126, il11aOE_DMSO, and il11aOE_U0126, respectively. Scale bars, 25 µm in (a) and (g), 50 µm in (c) and (i). Data are mean ± SEM in (b), (d), (h) and (j). p-values were determined by unpaired two-tailed t-test in (b), (d), (h) and (j).
|