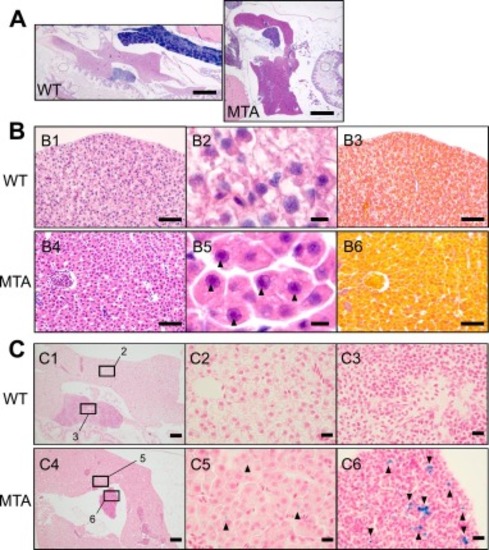
Abnormal appearance of hepatocytes and iron depositions in the liver and spleen of the slc25a20 mutant. (A) Representative images of the whole liver from hematoxylin and eosin (HE)-stained paraffin sections of the individuals. Scale bar, 0.5 mm. (B) Representative images of liver tissues from the wild-type fish (B1–3) and the mutant (B4–6). (B1, B4) Low-magnification images of the livers from HE-stained paraffin sections. Scale bars, 50 μm. (B2, B5) High-magnification images of hepatocytes. The back arrowheads indicate prominent nucleoli. Scale bars, 5 μm. (B3, B6) Images of azan-stained paraffin sections adjacent to those in B1 and B4. (C) Representative images of the liver and spleen from Prussian blue-stained paraffin sections of the wild-type fish (C1–3) and the mutant (C4–6). (C1, C4) Low-magnification images. Squares correspond to the magnified regions shown in the following images. Scale bars, 100 μm. (C2, C5) High-magnification images of the livers. Scale bars, 10 μm. (C3, C6) High-magnification images of the spleens. The back arrowheads indicate focal trace iron depositions. Scale bars, 10 μm.
|
