
Fig. 7
- ID
- ZDB-FIG-250122-8
- Publication
- Matsumoto et al., 2024 - Foxo3-mediated physiological cell competition ensures robust tissue patterning throughout vertebrate development
- Other Figures
- All Figure Page
- Back to All Figure Page
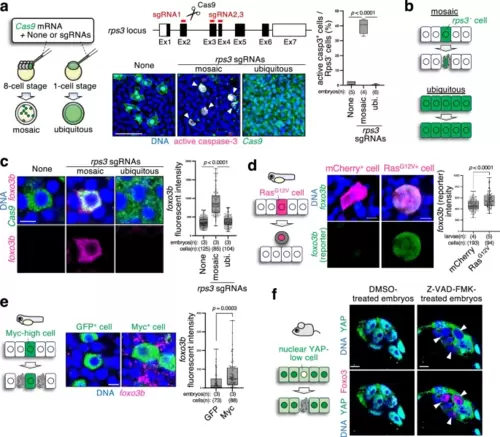
Foxo3 is a universal marker of cell competition. a Cell competition eliminates rps3 mutant cells. The schematic diagram on the left shows the experimental introduction of rps3 mutant cells into zebrafish embryos in a mosaic or ubiquitous manner using CRISPR/Cas9-mediated genome editing. Confocal images show whole-mount immunostaining of embryos (9 hpf) without rps3 mutants (none) or with mosaic or ubiquitous rps3 mutants (green) and active caspase-3 (magenta). Scale bar = 100 µm. The box plot on the right shows the mean + SEM of the GFP+ and caspase-3 active cell frequencies. Maximum and minimum: whiskers; medians: lines; 25th and 75th percentiles: boxes. Two-tailed one-way ANOVA was used. b Schematic illustration indicating that rps3 mutant cells are eliminated by competition with neighbouring normal cells. c rps3 mutant cells upregulate foxo3b. Representative images show whole-mount in situ hybridisation of foxo3b mRNA (magenta) in embryos without rps3 mutants (none) or with mosaic or ubiquitous rps3 mutants (green). Scale bar = 10 μm. d Oncogenic RasG12V cells show upregulated foxo3b expression. Confocal images show endogenous foxo3b (green) expression in Tg(foxo3b:GFP) 24 hpf larvae expressing mCherry alone or with RasG12V. Scale bar = 10 μm. e Myc-surrounding cells upregulate foxo3b. Myc-high cells communicate with and induce apoptosis in the surrounding Myc-low cells. Representative images show whole-mount in situ hybridisation of foxo3b mRNA (magenta) in mosaic embryos (9 hpf) expressing GFP alone or with Myc. Scale bar = 10 μm. In the box plot on the right shows the mean + SEM of the foxo3b intensity of each GFP+ cell (c), mCherry+ cell (d), and cells neighbouring GFP+ cell (e). Maximum and minimum: whiskers; medians: lines; 25th and 75th percentiles: boxes. An unpaired wo-tailed one-way ANOVA was used. f Nuclear YAP-low loser cells in mouse pre-implantation epiblast express Foxo3. Representative images show whole-mount immunostaining for YAP (green) and Foxo3 (magenta) in DMSO-treated (control) or Z-VAD-FMK-treated (apoptosis-inhibited) embryos. Note that most of the cells in DMSO-treated embryos are nuclear YAP-high and Foxo3-low, but Z-VAD-FMK treatment increased nuclear YAP-low and Foxo3-high cells. Scale bar = 10 μm. Source data are provided as a Source Data file. |