Fig. 2
- ID
- ZDB-FIG-250128-48
- Publication
- Lopes-Bastos et al., 2024 - The absence of telomerase leads to immune response and tumor regression in zebrafish melanoma
- Other Figures
- All Figure Page
- Back to All Figure Page
|
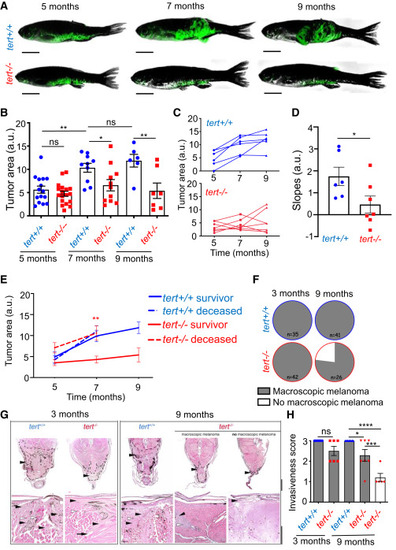
Absence of telomerase restricts tumor growth, leading to melanoma regression (A–D) Lack of telomerase impacts late tumor growth. (A) Examples of melanoma evolution over time of tert+/+ and tert−/− fish. Scale bars: 0.5 cm. (B) Quantification of tumor size of 5-, 7-, and 9-month-old tert+/+ and tert−/− fish (n ≥ 7; one-way ANOVA). (C) Evolution tumor size over time in individual animals (n = 6 and n = 7). (D) Slope of tumor size evolution calculated using linear regression of three time points (n ≥ 6; unpaired t test). (E) Larger tumors are associated with tert−/− fish lethality. Tumor size evolution of fish that either survived until 9 months (solid line: survival group) or died after 7 months (dashed line: non-survivor group). Statistics compare tert−/− survivors with tert−/− deceased fish at 7 months (n ≥ 7; unpaired t test). (F–H) Melanoma regresses in fish lacking telomerase. (F) tert+/+ and tert−/− fish with macroscopic tumors at 3 and 9 months of age. (G) Histopathology analysis of melanoma of 3- and 9-month-old tert+/+ and tert−/− zebrafish. Tumors are indicated by a black arrowhead and dashed line. Higher magnification shows infiltrative features of melanoma (black arrowhead), with marked invasion, destruction, and replacement of the hypaxialis muscle (white arrowhead). Top scale bar: 500 μm, bottom scale bar: 200 μm. (H) Quantification of melanoma invasiveness: (1) non-invasive, (2) minimally invasive, and (3) invasive (n ≥ 5; one-way ANOVA). Error bars represent ± SEM; each dot represents an individual tumor; ∗p ≤ 0.05, ∗∗p ≤ 0.01, ∗∗∗p ≤ 0.001, and ∗∗∗∗p ≤ 0,0001. ns, not significant; a.u., arbitrary units. |

