
Fig. 1
- ID
- ZDB-FIG-251112-64
- Publication
- Torres-Pérez et al., 2025 - Lack of Williams syndrome-associated genes alters quantity discrimination in zebrafish
- Other Figures
- All Figure Page
- Back to All Figure Page
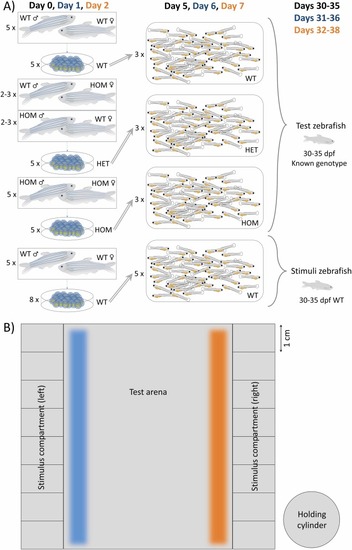
Experimental plan and group size preference (GSP) assay. A) Breeding strategy for each trial. Numbers (2–5 x) show minimal numbers used for each step. Each trial consisted of three consecutive breeding days (day 0: first day of breeding, in black; day 1: second day of breeding, in blue; day 3: third day of breeding, in orange). At the corresponding 5 days post-fertilization (dpf), fry were transferred to a recirculating system and maintained until 30–35 dpf for testing (same colour code as breeding days). B) Diagram of the testing chamber and the holding cylinder. Note that there are two stimulus compartments, one at the left and one at the right of the test arena, which are further subdivided in smaller compartments to singly-house stimulus fish. During each GSP test, Ethovision system is used to record the time spent by the test zebrafish close to the stimulus compartments, the two 1 cm bands along the 8 cm ends of the test arena (blue and orange for left and right respectively). |