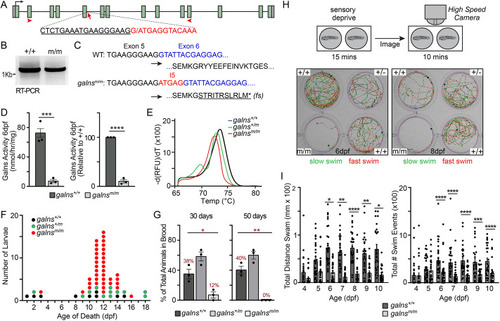
Mutation of an essential splice site generates a null allele of galns. (A) Schematic of galns gene structure with the exon 5–intron 5 boundary and G/A mutation highlighted, denoted by an arrow. Arrowheads indicate the position of the oligonucleotide primers used for RT-PCR and sequence analysis. (B) RT-PCR analysis of galns transcript in 8 days post-fertilization (dpf) wild-type (+/+) and mutant (m/m) larvae. (C) Long-read sequence analysis performed using Oxford Nanopore Technologies identified 5 bp on intron 5 (I5) inserted into the transcript in galns mutant larvae. The predicted impact of this insertion on the amino acid sequence (as shown) includes a shift in frame and introduction of an early stop codon. Sequencing was performed on mRNA-isolated samples containing 30 larvae. (D) Galns enzyme assays performed on larvae 6 dpf detected little to no activity in galns mutants (m/m). n=3 biological replicates of samples containing 25 larvae per genotype. Error bars=s.e.m. Two-tailed paired Student's t-test, ***P<0.001, ****P<0.0001. (E) A high-resolution melt curve assay was developed to genotype animals for experiments and line propagation. (F) The progeny from multiple pairwise heterozygous crosses were analyzed daily from 0 to 18 dpf. All progeny were genotyped as they died. The number of progeny per genotype that died at each timepoint is indicated on the graph, with the majority of galns mutants (m/m) dying between 9 and 14 dpf. (G) All progeny of three independent pairwise heterozygous crosses were genotyped at 30 and 50 dpf. The numbers of animals per genotype were identified at each timepoint. n=3 biological replicates with a total of 25-50 animals per experiment. Error bars=s.e.m. Dunnett's multiple comparisons test, *P<0.05, **P<0.01. (H) Zebrabox automated behavioral tracking identified a progressive motility defect in galnsm/m mutant larvae. Representative images of traced swim paths of larvae 6 and 8 dpf. Green traces represent periods of slow-speed swimming; red traces represent fast-speed swimming. (I) Graphs comparing total distance swam and the number of swim events initiated 4-10 dpf in wild-type (+/+) and mutant (m/m) larvae. Each dot represents one animal. n=30 larvae from three biological matings. Error bars=s.e.m. *P<0.05, **P<0.01, ***P<0.001, ****P<0.0001.
|
