
FIGURE
Figure 2
- ID
- ZDB-FIG-260530-162
- Publication
- Sun et al., 2026 - Functional and Genetic Analyses Unveil the Implication of hoxa4a in Zebrafish Craniofacial Development
- Other Figures
- All Figure Page
- Back to All Figure Page
Figure 2
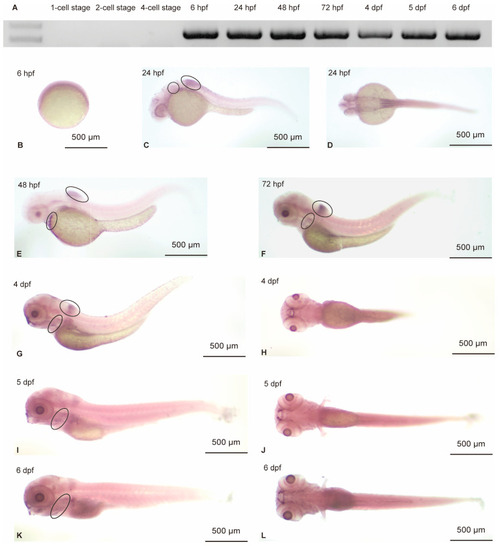
Temporal expression profile of hoxa4a during zebrafish development. (A) RT-PCR analysis demonstrating that hoxa4a transcripts were detectable from 6 hpf through 6 dpf. (B–L) ISH results confirming the same expression window (6 hpf to 6 dpf) for hoxa4a. (C,D) hoxa4a expression in the otic vesicle and dorsal hindbrain at 24 hpf. (E–L) hoxa4a expression in the pharyngeal arches from 48 hpf to 6 dpf. |
Expression Data
| Gene: | |
|---|---|
| Fish: | |
| Anatomical Terms: | |
| Stage Range: | Shield to Day 6 |
Expression Detail
Antibody Labeling
Phenotype Data
Phenotype Detail
Acknowledgments
This image is the copyrighted work of the attributed author or publisher, and
ZFIN has permission only to display this image to its users.
Additional permissions should be obtained from the applicable author or publisher of the image.
Full text @ J Dev Biol