
FIGURE
Fig. 1
- ID
- ZDB-FIG-260729-75
- Publication
- Geng et al., 2026 - Expression Analysis of the TMC Gene Family in the Auditory System During Zebrafish Embryonic Development
- Other Figures
- All Figure Page
- Back to All Figure Page
Fig. 1
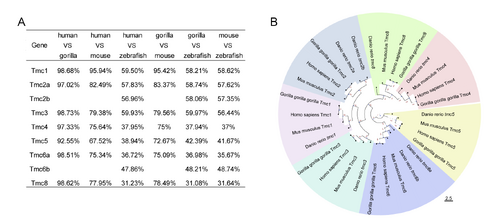
Comparative sequence analysis and phylogeny of the TMC gene family across vertebrates. (A) Pairwise sequence identity (%) of TMC1–TMC8 among human, gorilla, mouse, and zebrafish, showing high conservation in mammals and greater divergence in zebrafish. (B) Maximum-likelihood phylogenetic tree of TMC proteins based on full-length sequences. Colored sectors indicate TMC subgroups. Bootstrap values of 50% or greater are shown. |
Expression Data
Expression Detail
Antibody Labeling
Phenotype Data
Phenotype Detail
Acknowledgments
This image is the copyrighted work of the attributed author or publisher, and
ZFIN has permission only to display this image to its users.
Additional permissions should be obtained from the applicable author or publisher of the image.
Reprinted from Gene expression patterns : GEP, , Geng, K., Wang, X., Wang, X., Liu, D., Qian, F., Expression Analysis of the TMC Gene Family in the Auditory System During Zebrafish Embryonic Development, 119409, Copyright (2026) with permission from Elsevier. Full text @ Gene Expr. Patterns