
Image
|
Figure Caption
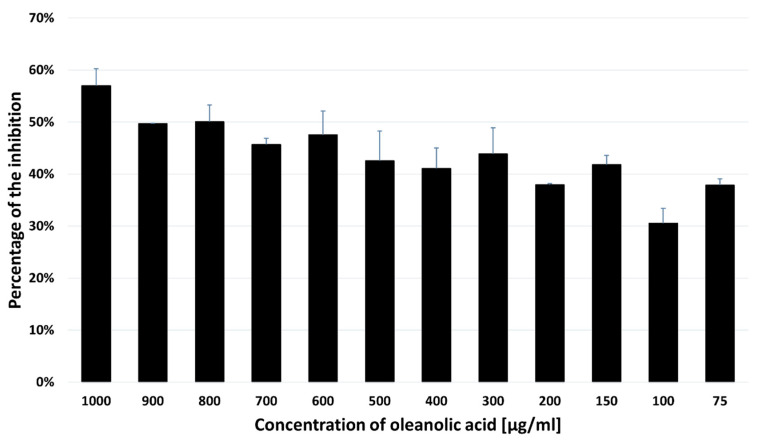
Figure 5
MTT results for the SH-SY5Y cells treated with OA. The OA IC50 value was calculated to be 715 µg/mL. The data are presented as the mean ± standard deviation (SD) of 3 independent experiments.
Acknowledgments
This image is the copyrighted work of the attributed author or publisher, and
ZFIN has permission only to display this image to its users.
Additional permissions should be obtained from the applicable author or publisher of the image.
Full text @ Pharmaceuticals (Basel)