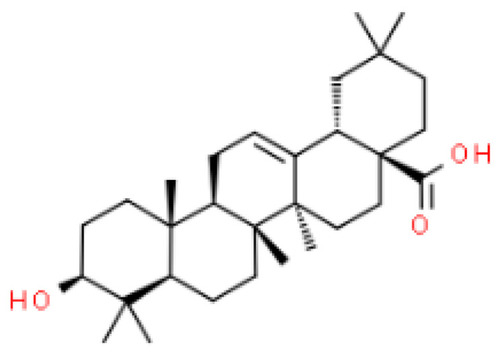
Chemical structure of oleanolic acid.

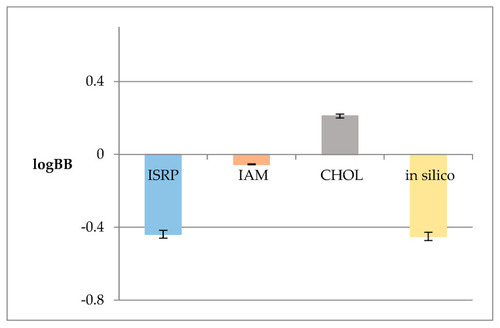
LogBB values calculated based on the QSAR model logkw values from the anisotropic membrane-like systems (ISRP, IAM, CHOL) and that calculated in silico using the ACD/Percepta software.

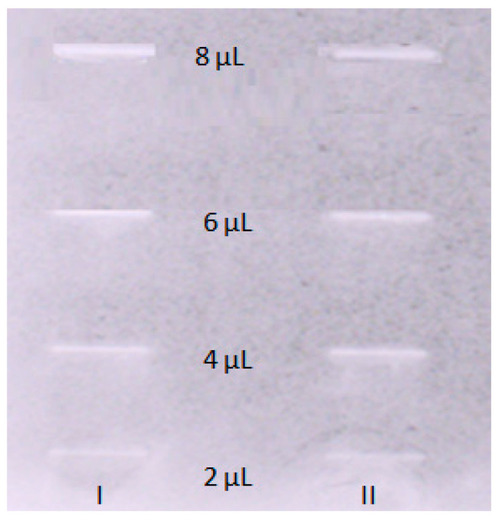
TLC bioautography results for acetylcholinesterase inhibition visualized in daylight. The TLC plate shows different concentrations of OA. I—1st; II—2nd replications.

(left) The 1D free energy profiles accompanying the OA molecule movement through the system, including lipid bilayer. The systems contained two types of uniform bilayers: comprising POPC (red lines), or POPG (green lines). The associated error values (shown as vertical bars) were determined using bootstrapping. (right) The most favorable binding pose of the OA molecule interacting with AChE. The OA molecule is visualized as ball-and-stick, while amino acid residues in close proximity (within a distance of 0.38 nm) are depicted as thin sticks. Further details about the types of interactions are available in the text. The residue numbering is consistent with the PDB:3EVE record.

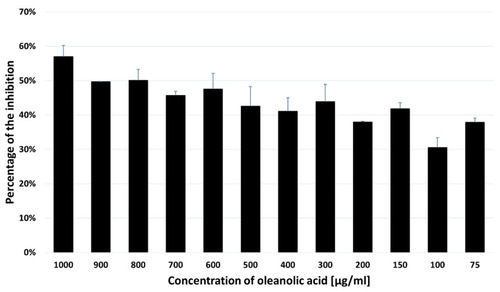
MTT results for the SH-SY5Y cells treated with OA. The OA IC50 value was calculated to be 715 µg/mL. The data are presented as the mean ± standard deviation (SD) of 3 independent experiments.

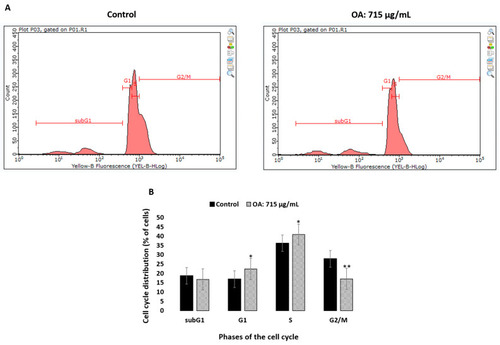
Effect on the phases of cell cycle in the SH-SY5Y cells treated with OA. (A)—The cell cycle distribution of PI-labelled cells was analyzed by flow cytometry in the SH-SY5Y control cells and cells treated with OA (715 µg/mL) for 48 h. (B)—The histogram shows the percentage of cells that are in different phases of the cell cycle. The results are expressed as the mean ± SD of three independent experiments. The p values below 0.05 (* p < 0.05, ** p < 0.0001) are considered statistically significant. The treated SH-SY5Y cells were arrested in the G1 phase and the percentage of cells in this phase increased from 16.87 ± 0.68% in the untreated cells to 23.57 ± 1.36% in the cells treated with oleanolic acid. Incubation with OA also caused an increase in the proportion of cells in the S phase (36.18 ± 1.50% vs. 40.85 ± 0.73%, p = 0.023) and a significant decrease in the G2/M phase (27.82 ± 0.86% vs. 17.02 ± 1.75%, p < 0.0001) of the cell cycle in the treated SH-SY5Y cells in comparison with the control.

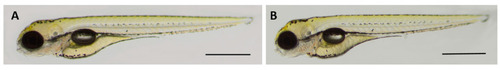
Representative photo of 4 dpf (A) control and (B) OA-treated larvae. Scale bars 1 mm.

Acknowledgments
This image is the copyrighted work of the attributed author or publisher, and ZFIN has permission only to display this image to its users. Additional permissions should be obtained from the applicable author or publisher of the image. Full text @ Pharmaceuticals (Basel)