FIGURE

Figure 4

ID
ZDB-FIG-231002-273
Publication
Stępnik et al., 2023 - Neuroprotective Properties of Oleanolic Acid-Computational-Driven Molecular Research Combined with In Vitro and In Vivo Experiments
Other Figures
All Figure Page
Back to All Figure Page
Figure 4

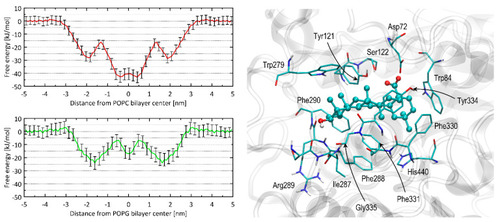
(left) The 1D free energy profiles accompanying the OA molecule movement through the system, including lipid bilayer. The systems contained two types of uniform bilayers: comprising POPC (red lines), or POPG (green lines). The associated error values (shown as vertical bars) were determined using bootstrapping. (right) The most favorable binding pose of the OA molecule interacting with AChE. The OA molecule is visualized as ball-and-stick, while amino acid residues in close proximity (within a distance of 0.38 nm) are depicted as thin sticks. Further details about the types of interactions are available in the text. The residue numbering is consistent with the PDB:3EVE record.

Expression Data

Expression Detail
Antibody Labeling
Phenotype Data

Phenotype Detail
Acknowledgments
This image is the copyrighted work of the attributed author or publisher, and ZFIN has permission only to display this image to its users. Additional permissions should be obtained from the applicable author or publisher of the image. Full text @ Pharmaceuticals (Basel)