
FIGURE
Figure 3
- ID
- ZDB-FIG-231002-272
- Publication
- Stępnik et al., 2023 - Neuroprotective Properties of Oleanolic Acid-Computational-Driven Molecular Research Combined with In Vitro and In Vivo Experiments
- Other Figures
- All Figure Page
- Back to All Figure Page
Figure 3
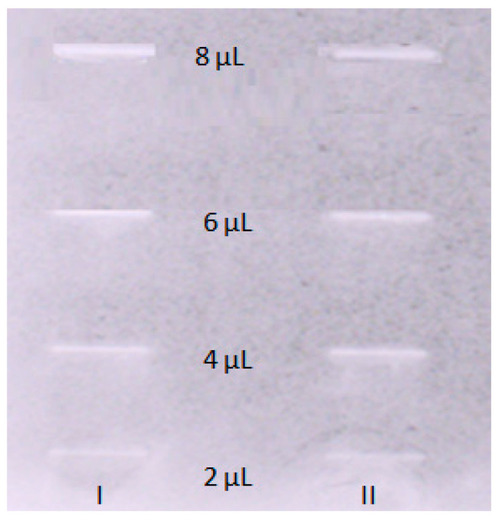
TLC bioautography results for acetylcholinesterase inhibition visualized in daylight. The TLC plate shows different concentrations of OA. I—1st; II—2nd replications. |
Expression Data
Expression Detail
Antibody Labeling
Phenotype Data
Phenotype Detail
Acknowledgments
This image is the copyrighted work of the attributed author or publisher, and
ZFIN has permission only to display this image to its users.
Additional permissions should be obtained from the applicable author or publisher of the image.
Full text @ Pharmaceuticals (Basel)