FIGURE

Figure 6

ID
ZDB-FIG-231002-275
Publication
Stępnik et al., 2023 - Neuroprotective Properties of Oleanolic Acid-Computational-Driven Molecular Research Combined with In Vitro and In Vivo Experiments
Other Figures
All Figure Page
Back to All Figure Page
Figure 6

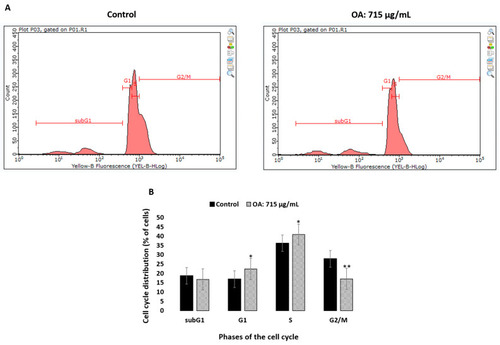
Effect on the phases of cell cycle in the SH-SY5Y cells treated with OA. (A)—The cell cycle distribution of PI-labelled cells was analyzed by flow cytometry in the SH-SY5Y control cells and cells treated with OA (715 µg/mL) for 48 h. (B)—The histogram shows the percentage of cells that are in different phases of the cell cycle. The results are expressed as the mean ± SD of three independent experiments. The p values below 0.05 (* p < 0.05, ** p < 0.0001) are considered statistically significant. The treated SH-SY5Y cells were arrested in the G1 phase and the percentage of cells in this phase increased from 16.87 ± 0.68% in the untreated cells to 23.57 ± 1.36% in the cells treated with oleanolic acid. Incubation with OA also caused an increase in the proportion of cells in the S phase (36.18 ± 1.50% vs. 40.85 ± 0.73%, p = 0.023) and a significant decrease in the G2/M phase (27.82 ± 0.86% vs. 17.02 ± 1.75%, p < 0.0001) of the cell cycle in the treated SH-SY5Y cells in comparison with the control.

Expression Data

Expression Detail
Antibody Labeling
Phenotype Data

Phenotype Detail
Acknowledgments
This image is the copyrighted work of the attributed author or publisher, and ZFIN has permission only to display this image to its users. Additional permissions should be obtained from the applicable author or publisher of the image. Full text @ Pharmaceuticals (Basel)