
|
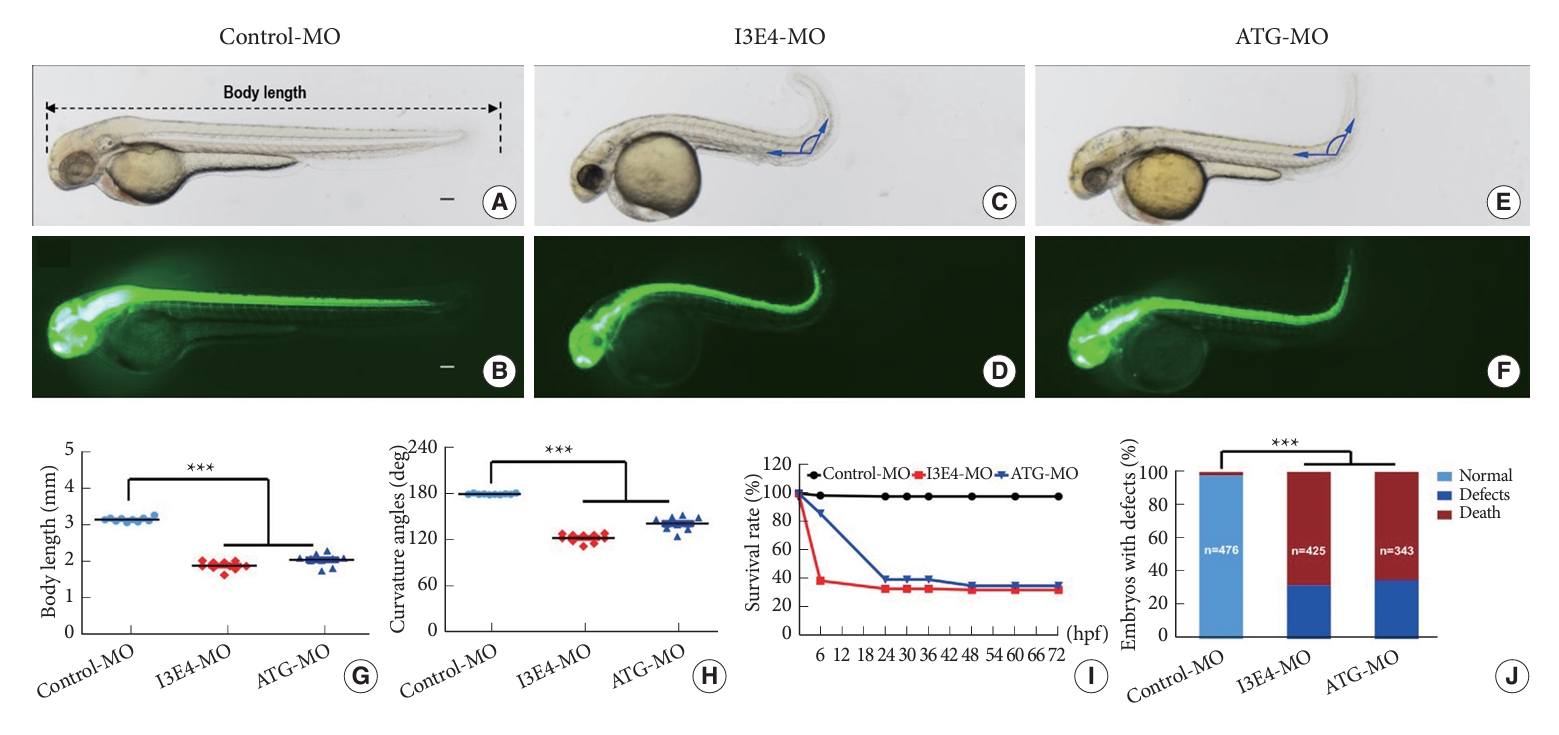
Fig. 1 Body length, body axis and survival rate of best1 zebrafish morphants. (A–F) Gross morphology of transgenic (HuC:EGFP) zebrafish embryos at 2-dpf. Compared with control morpholino (MO), knock down best1 causes shorter body length (C–F), curved body axis (C–F). (G) A time-course plot of percent survival in control versus best1 morphants for 3 days. (H) The percentage of embryos with development defects. (I, J) Quantification of body length (I) and curvature angles (J) of embryos. Columns, mean; standard error of the mean (n = 10; analysis of variance), ***p < 0.0001. Scale bar, 100 μm. dpf, days post fertilization.