
|
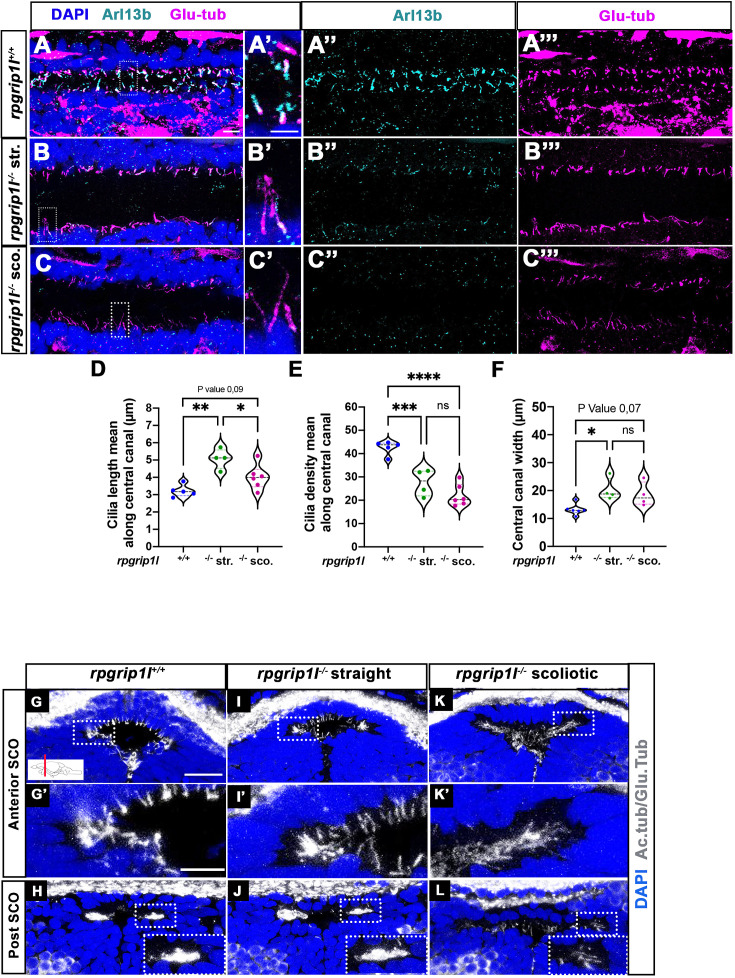
Figure 2 Altered ciliogenesis at trunk and subcommissural organ (SCO) levels. (A-C’’’) Immunostaining of trunk sagittal sections at the level of the spinal cord central canal in rpgrip1l+/+ (A-A’’’; n=5), straight rpgrip1l-/- (B-B’’’; n=4) and scoliotic rpgrip1l-/- fish (C-C’’’; n=6) at 8 weeks (N=2 independent experiments). Cilia were immunostained with Arl13b (cyan, A’’, B’’, C’’) and glutamylated-tubulin (magenta, A’’’, B’’’, C’’’). Panels A-C’ are merged images with DAPI. Panels A’, B’ and C’ show higher magnification of the squared regions in A, B and C, respectively. Scale bars: 10 μm in A, 5 μm in A’. (D) Violin plot showing the distribution of cilia length along the central canal of rpgrip1l+/+ siblings (n=300 cilia from 5 fish), straight rpgrip1l-/- (n=267 from 4 fish) and scoliotic rpgrip1l-/- (n=414 from 6 fish) juvenile fish (N=2). (E) Violin plot showing the distribution of cilia density along the central canal of juvenile rpgrip1l+/+ siblings (n=5), straight rpgrip1l-/- (n=4) and scoliotic rpgrip1l-/- fish (n=6) (N=2). Density is the average number of ventral and dorsal cilia lining the CC over a length of 100 µm from three to five sections for each fish. Each dot represents the mean cilia length (D) or cilia density (E) of four to eight sections analyzed at different antero-posterior levels. Statistical analysis was performed using Tukey’s multiple comparisons test where * means p-value <0.05; ** means p-value <0.01; *** means p-value <0.001; **** means p-value <0.0001. (F) Violin plot showing the distribution of width of the central canal (nuclear-free region) (in µm) of juvenile rpgrip1l+/+ (n=5), straight rpgrip1l-/- (n=4) and scoliotic rpgrip1l-/- fish (n=6) (N=2). Each dot represents the mean of 3 measurements made at different AP levels. Statistical analysis was performed using Tukey’s multiple comparisons test where ns means non-significant, * means p-value <0.05. (G–L) Immunostaining of cilia on transverse sections of the brain at SCO level using glutamylated-tubulin and acetylated-tubulin antibodies (both in white), in rpgrip1l+/+ (n=6) (G, G’, H), straight rpgrip1l-/- (n=3) (I, I’, J) and scoliotic rpgrip1l-/- (n=7) (K, K’, L) 8 wpf fish (N=2). Nuclei were stained with DAPI (blue). G’, I’ and K’ are higher magnifications of squared regions in G, I and K, respectively. In H, J and L the bottom-right inset represents a higher magnification of the squared region. Scale bars in G and G’: 10 µm.