
- Title
-
Astrogliosis and neuroinflammation underlie scoliosis upon cilia dysfunction
- Authors
- Djebar, M., Anselme, I., Pezeron, G., Bardet, P.L., Cantaut-Belarif, Y., Eschstruth, A., López-Santos, D., Le Ribeuz, H., Jenett, A., Khoury, H., Veziers, J., Parmentier, C., Hirschler, A., Carapito, C., Bachmann-Gagescu, R., Schneider-Maunoury, S., Vesque, C.
- Source
- Full text @ Elife
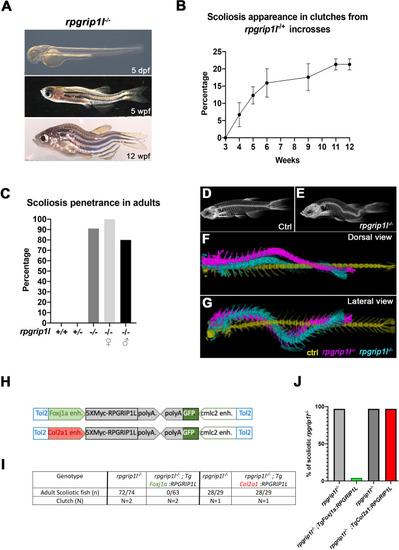
rpgrip1l-/- juvenile fish develop scoliosis, which is rescued by RPGRIP1L expression in foxj1a-positive cells. (A) Representative rpgrip1l-/- fish at 5 days post-fertilization (dpf) (4 mm body length, larvae), 5 weeks pf (wpf) (1.2 cm body length, juveniles) and 12 wpf (2.5 cm body length, adults), showing absence of morphological defects in embryos, onset of spine curvature (tail-up) in juveniles and scoliosis in adults. (B, C) Graph showing the time course of scoliosis appearance (B) in rpgrip1l-/+ incrosses (total 4 clutches, 252 fish) and scoliosis penetrance (C) in adults. (D, E) Micro-computed tomography (μCT) scans of control siblings (D) and rpgrip1l-/- (E) adult fish. Four fish were analyzed for each condition. (F, G) Dorsal and lateral superimposed μCT views of the spines of one control (yellow) and two rpgrip1l-/- (pink, cyan) adult fish illustrating the 3D spine curvatures in mutants. (H) Schematic representation of the two rescue constructs. (I) Table presenting the number and phenotype of rpgrip1l-/- fish generated for both rescue experiments by stable transgenesis (J) Graph representing scoliosis penetrance in transgenic and non-transgenic rpgrip1l-/- siblings. |

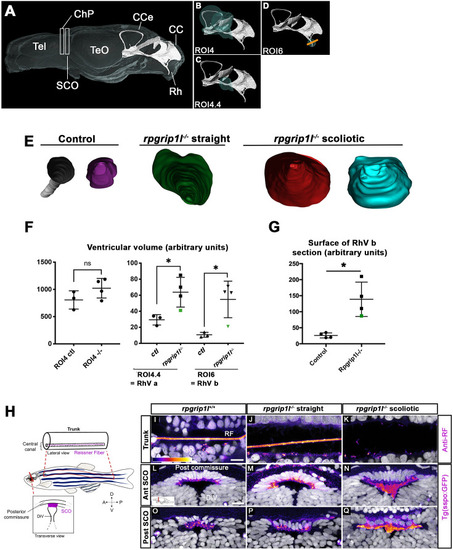
Production and characterization of the rpgrip1∆ and rpgrip1lex4 fish lines. (A) Schematic exon-intron structure of the Danio rerio rpgrip1l gene. Two alleles were produced by CRISPR/cas9-mediated genome engineering, rpgrip1lex4 with a nonsense mutation in exon 4 and rpgrip1l∆4-25 (also called rpgrip1l∆ or rpgrip1l-) with a large deletion between exons 4 and 25, encompassing most of the protein coding sequence. Both alleles had identical embryonic phenotype (panel B and data not shown). (A’) Electrophoresis gel showing the migration profile of amplicons for each genotype, rpgrip1lΔ/Δ, rpgrip1lΔ/+, rpgrip1+l/+ produced by triplex PCR (B) Absence of laterality defects and kidney cysts in rpgrip1lΔ/Δ and rpgrip1lex4/ex4 embryos. (C) Immunostaining on whole 30 hpf control (left panels) and rpgrip1l-/- (right panels) embryos to visualize the RF (anti-RF antibody, middle panels) and cilia (acetylated tubulin antibody, lower panels) in the caudal region. Nuclei (upper panels) are stained with DAPI. The RF is present in the central canal of rpgrip1l-/- embryos, as well as cilia in the whole neural tube width. Scale bar: 6 µm for upper panels; 15 µm for lower panels. (D, E) Absence of retinal morphological defects in 5 dpf rpgrip1l-/- larvae. Retinal sections of control (D) and rpgrip1l-/- (E) larvae were immunostained with Zpr3 (red) to label the external segment of photoreceptors and Acetylated Tubulin (Ac Tub) (green) to label axonemes. (D’) and (E’) are insets in (D) and (E) focusing on the photoreceptor layer. Scale bar: 50 μm. (F-H’’’) Scanning electron microscopy of brain ventricles in control (F-F’’), straight (str.) rpgrip1l-/- (G-G’’) and scoliotic (sco.) rpgrip1l-/- (H-H’’’) adult (3 months) fish. Ependymal multiciliated cells of the rhombencephalic ventricle (RhV) are almost totally absent in rpgrip1l-/- scoliotic fish (H-H'), while they are present in straight rpgrip1l-/-(G-G') and controls (F-F'). Cilia of hindbrain mono-ciliated cells in rpgrip1l-/- (F’’, G’’) and controls (G’’). Scale bars: 10 μm for (F-I), 2 μm for F’-H’, 1 μm for F’’, G’’, H‘’ and H’’’. |
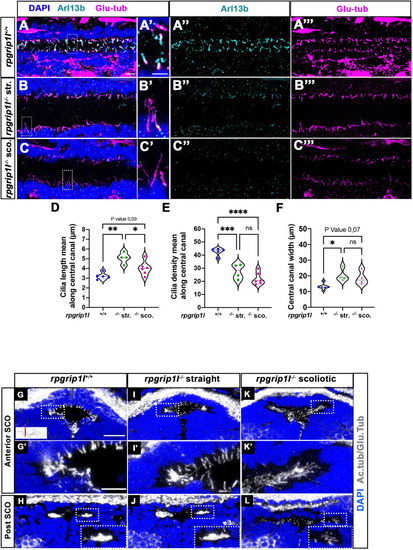
Altered ciliogenesis at trunk and subcommissural organ (SCO) levels. (A-C’’’) Immunostaining of trunk sagittal sections at the level of the spinal cord central canal in rpgrip1l+/+ (A-A’’’; n=5), straight rpgrip1l-/- (B-B’’’; n=4) and scoliotic rpgrip1l-/- fish (C-C’’’; n=6) at 8 weeks (N=2 independent experiments). Cilia were immunostained with Arl13b (cyan, A’’, B’’, C’’) and glutamylated-tubulin (magenta, A’’’, B’’’, C’’’). Panels A-C’ are merged images with DAPI. Panels A’, B’ and C’ show higher magnification of the squared regions in A, B and C, respectively. Scale bars: 10 μm in A, 5 μm in A’. (D) Violin plot showing the distribution of cilia length along the central canal of rpgrip1l+/+ siblings (n=300 cilia from 5 fish), straight rpgrip1l-/- (n=267 from 4 fish) and scoliotic rpgrip1l-/- (n=414 from 6 fish) juvenile fish (N=2). (E) Violin plot showing the distribution of cilia density along the central canal of juvenile rpgrip1l+/+ siblings (n=5), straight rpgrip1l-/- (n=4) and scoliotic rpgrip1l-/- fish (n=6) (N=2). Density is the average number of ventral and dorsal cilia lining the CC over a length of 100 µm from three to five sections for each fish. Each dot represents the mean cilia length (D) or cilia density (E) of four to eight sections analyzed at different antero-posterior levels. Statistical analysis was performed using Tukey’s multiple comparisons test where * means p-value <0.05; ** means p-value <0.01; *** means p-value <0.001; **** means p-value <0.0001. (F) Violin plot showing the distribution of width of the central canal (nuclear-free region) (in µm) of juvenile rpgrip1l+/+ (n=5), straight rpgrip1l-/- (n=4) and scoliotic rpgrip1l-/- fish (n=6) (N=2). Each dot represents the mean of 3 measurements made at different AP levels. Statistical analysis was performed using Tukey’s multiple comparisons test where ns means non-significant, * means p-value <0.05. (G–L) Immunostaining of cilia on transverse sections of the brain at SCO level using glutamylated-tubulin and acetylated-tubulin antibodies (both in white), in rpgrip1l+/+ (n=6) (G, G’, H), straight rpgrip1l-/- (n=3) (I, I’, J) and scoliotic rpgrip1l-/- (n=7) (K, K’, L) 8 wpf fish (N=2). Nuclei were stained with DAPI (blue). G’, I’ and K’ are higher magnifications of squared regions in G, I and K, respectively. In H, J and L the bottom-right inset represents a higher magnification of the squared region. Scale bars in G and G’: 10 µm. |
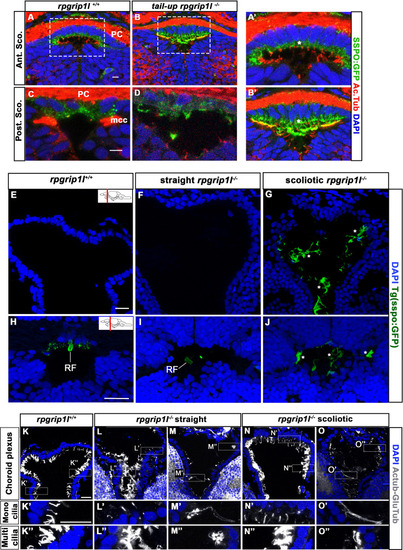
Presence of scospondin aggregates and heterogenous ciliary defects in the fChP of ( |
( |

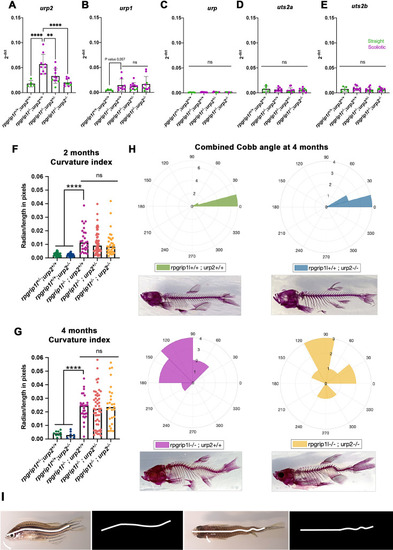
Upregulation of urp1/2 expression does not contribute to axis curvature of rpgrip1l-/- fish. Quantitative reverse transcription polymerase chain reaction (qRT-PCR) assaying urp2 expression level in rpgrip1l-/- and rpgrip1l+/+ (WT) siblings. Each dot represents the value obtained for one fish. Green and purple dots represent straight and scoliotic rpgrip1l-/- fish, respectively. qRT-PCR analysis was performed at 5 wpf (juvenile stage, 5 controls and 7 rpgrip1l-/-) and 12 wpf (adult stage, 5 controls and 9 rpgrip1l-/-). urp2 expression levels are increased by approximately 3.5-fold in rpgrip1l-/- at both stages. Statistical analysis was performed using unpaired t-test where **p<0.01. Error bars represent s.d. (B) Quantification of body axis curvature from dorsal and lateral views in 4 mpf fish issued from [rpgrip1l+/-, urp2+/-] incrosses. Each point represents the value measured for one fish. Statistical analysis was performed using Tukey’s multiple comparisons test where **** p<0.0001 with error bars represent s.d. n=9 [rpgrip1l+/+; urp2+/+], 7 [rpgrip1l+/+; urp2-/-], 27 [rpgrip1l-/-; urp2+/+], 48 [rpgrip1l-/-; urp2+/-] and 27 [rpgrip1l-/-; urp2-/-] fish. (C) Representative [rpgrip1l-/-; urp2+/+] and sibling [rpgrip1l-/-; urp2-/-] fish on lateral and dorsal views at 12 wpf. Scale bar 5 mm. (D, E) Expression levels of urp2 (D) and urp1 (E) in adult fish (12 wpf). Each dot represents the value for one fish. Green and purple dots represent straight and scoliotic rpgrip1l-/- fish, respectively (n=5 [rpgrip1l+/+; urp2+/+], 9 [rpgrip1l+/+; urp2-/-], 11 [rpgrip1l-/-; urp2+/-] and 10 [rpgrip1l-/-; urp2-/-]). Each gene expression level is compared to the lsm12b housekeeping gene. Statistical analysis was performed using Tukey’s multiple comparisons test where ns means non-significant and ** p<0.01, ****; ***p<0.001; p<0.0001. Error bars represent s.d. |
Genetic invalidation of ( |

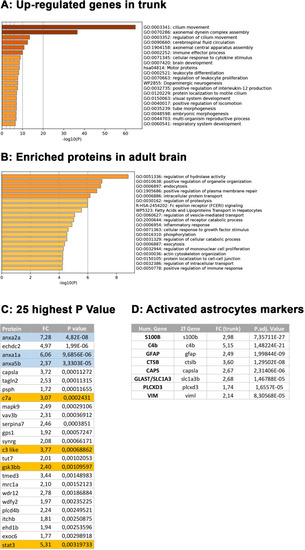
Comparative transcriptome and proteome analysis of control and rpgrip1l-/- fish. (A, B) Volcano-plots showing differentially regulated genes in the transcriptomes of the brain (A) and dorsal trunk (B) comparing 5 controls (2 wt, 3 rpgrip1l-/+) and 7 rpgrip1l-/- (6 tail-up and 1 straight) fish at 5 wpf (0.9 cm body length). Each dot corresponds to one gene. A gene was considered deregulated if its associated P-adj. value was inferior to 0.05. Red and blue dots represent up-regulated (Log2FC >0.75), and down-regulated (Log2FC <–0.75) genes, respectively. The names of the top 25 most deregulated genes are boxed. (C) GO term analysis of biological processes in the brain samples using Metascape. (D) Venn diagram of the upregulated genes in brain and trunk samples, showing many common genes between the two regions. (E) Selected genes of interest upregulated in the trunk and/or brain of rpgrip1l-/- fish. The four genes in red were also found upregulated in the proteome of adult rpgrip1l-/- fish. (F) Volcano-plot showing differentially expressed proteins in the brain of 5 rpgrip1l+/+ fish versus 5 rpgrip1l-/- adult scoliotic fish (3 months pf). Each dot corresponds to one protein. A protein was considered differentially expressed if its associated P-adj. value was inferior to 0.05. Red and blue dots represent proteins enriched (Log2FC >0.75) or depleted (Log2FC <–0.75) in mutant brains, respectively. The names of the top 25 most differentially expressed proteins are boxed. |
Complementary comparative transcriptome and proteomic analysis of ( |
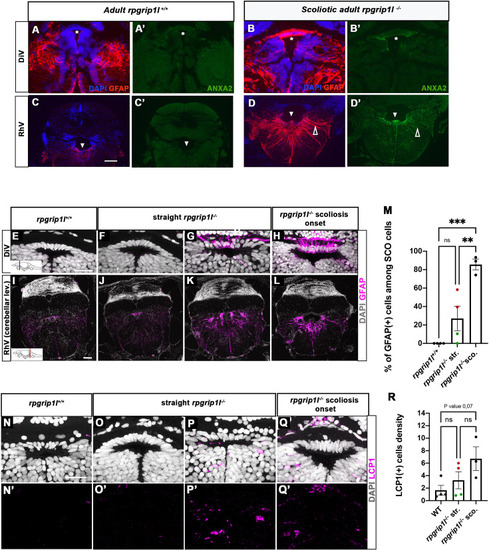
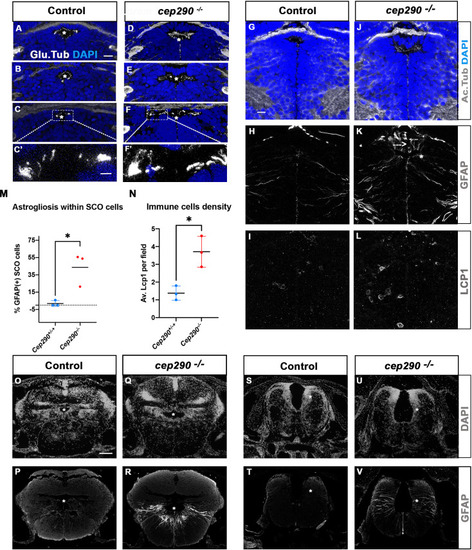
Anxa2 and GFAP upregulation and increased number of LCP1-positive cells around CNS ventricles of rpgrip1l-/- juvenile fish at scoliosis onset. (A-D’) Immunostaining for GFAP (A, B, C, D) and Anxa2 (A’, B’, C’, D’) on adult brain transverse sections at DiV (A-B’) and RhV at cerebellar level (C-D’) levels in controls (A, A’, C, C’) (n=3) and rpgrip1l-/- scoliotic (B, B’, D, D’) (n=4) fish. Nuclei are stained with DAPI (blue). White stars indicate the SCO, white triangles point to the ventral RhV region. Open arrows point to a long cellular process co-labeled by Anxa2 and GFAP. (E–L) Immunostaining for GFAP (magenta) on transverse sections of the brain at SCO (E–H) and RhV (I–L) levels in controls (E, I) (n=4), straight rpgrip1l-/- (F, G, J, K) (n=4) and scoliotic rpgrip1l-/- (H, L) (n=3) juvenile (8 wpf) fish. Nuclei are stained with DAPI (white). Scale bar: 125 µM for A-D’, 20 µm for E-H and 100 µm for I-L. (M) Graph representing the percentage of GFAP-positive cells among the total number of SCO cells in control (n=4), straight rpgrip1l-/- (n=4), and scoliotic rpgrip1l-/- (n=3) fish at scoliosis onset (N=1). Each dot represents the mean ratio of GFAP-positive over -negative cells in 3–6 sections per fish. Green dots correspond to fish with no or very low percentage of GFAP + cells, red dots to fish with a high percentage of GFAP + cells. Statistical analysis was performed with Tukey’s multiple comparisons test where ns means non-significant, ** means p-value <0.01 and *** p-value <0.001. Error bars represent s.d. ‘str’: straight; ‘sco’: scoliotic. (N-Q’) Immunostaining for LCP1 +microglia/macrophages (magenta) on brain transverse sections at SCO levels in a rectangle of 100 µm x 60 µm located under the posterior commissure in controls (n=4) (N, N’), straight rpgrip1l-/- (n=4) (O-P’) and rpgrip1l-/- at scoliosis onset (n=3) (Q, Q’) 8 wpf fish (N=1). Nuclei are stained with DAPI (white). Scale bar: 20 µm. (R) Quantification of LCP1 + cell density around the SCO in controls (n=4), straight rpgrip1l-/- (n=4) and scoliotic rpgrip1l-/- (n=3) at 8 wpf. Twenty-three sections were counted for control, 21 sections for rpgrip1l-/- straight, and 18 sections for rpgrip1l-/- scoliotic fish. Each dot represents the mean value for one fish. Green dots correspond to the fish without any GFAP +SCO cells, red dots correspond to the fish with GFAP +SCO cells (SCO cells are defined as the dorsal cells located underneath the posterior commissure and above the diencephalic ventricle). Note that straight rpgrip1l-/- fish with GFAP +SCO cells present a higher number of LCP1 + cells. Statistical analysis was performed with Tukey’s multiple comparisons test where ns means non-significant. Error bars represent s.e.m. ‘str’:straight ‘sco’: scoliotic. |
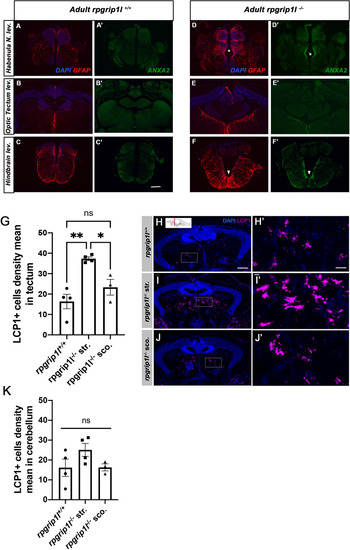
Increased GFAP and Annexin 2 staining and LCP1 + cell density in different brain regions. ( |
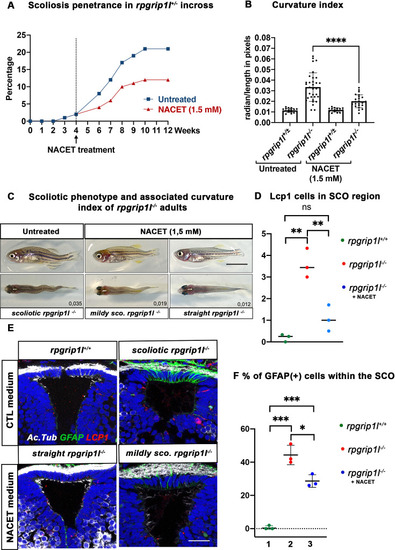
NACET treatment reduces scoliosis penetrance and severity in rpgrip1l-/- and decreases astrogliosis and LCP1 + cell number at SCO level. (A) Kinetics of scoliosis development in rpgrip1l+/- incrosses in the presence (n=150 fish) or absence (n=174 fish) of NACET treatment (1.5 mM) from 4 to 12 weeks (N=1). ‘str’: straight; ‘sco’: scoliotic. (B) Quantification of body axis curvature from dorsal and lateral views at 13 wpf, at the end of the NACET treatment. Each dot corresponds to one fish. Among the 174 fish raised in untreated condition, we measured 18 controls (rpgrip1l±/-) and 33 rpgrip1l-/-, and upon NACET treatment, 16 controls (rpgrip1l±/+) and 23 rpgrip1l-/-. rpgrip1l±/- represents a pool of rpgrip1l+/+ and rpgrip1l+/-. Statistical analysis was performed using Tukey’s multiple comparisons test where * means p-value <0.05; ** means p-value <0.01; *** means p-value <0.001; **** means p-value <0.0001. Error bars represent s.d. (C) Representative pictures of rpgrip1l-/- fish with their curvature index without or after NACET treatment, at 13 wpf. Scale bar is 0.5 cm. Left panels correspond to an untreated rpgrip1l-/- scoliotic fish on lateral (upper) and dorsal (lower) views. Middle panels represent treated rpgrip1l-/-, with a lower curvature index than scoliotic fish on lateral (upper) and dorsal (lower) views and right panels are pictures of rescued straight rpgrip1l-/- fish on lateral (upper) and dorsal (lower) views. (D) Graph representing the number of LCP1 + cells in wt (n=3), untreated rpgrip1l-/- (n=3) and NACET-treated rgprip1l-/- (n=3) fish in the SCO region (N=1). (E) Immunostaining for GFAP (green), Acetylated tubulin (white) and LCP1 (red) on adult brain transverse sections at SCO level in untreated (upper panels) and NACET-treated (lower panels) fish. Nuclei are stained with DAPI (blue). No GFAP staining was present in controls (n=3) (upper left), while untreated mutants displayed strong GFAP labeling (upper right) (n=3). NACET treatment totally suppressed gliosis in a straight rpgrip1l-/- fish (lower right panel) (n=1) and diminished the intensity of GFAP labeling in slightly tail-up rpgrip1l-/- (n=2). Scale bar: 12.5 µm. (F) Graph presenting the percentage of GFAP positive cells among the total number of SCO secretory cells compared between controls (n=3), untreated rpgrip1l-/- (n=3), and NACET treated rpgrip1l-/- adult fish (n=3) (N=1). Each dot represents the mean of % of GFAP-positive cells present in 3–6 sections per fish. |
Biological assay of NACET activity on ( |
Altered ciliogenesis, GFAP upregulation and increased number of LCP1-positive cells around ventricles of ( |