|
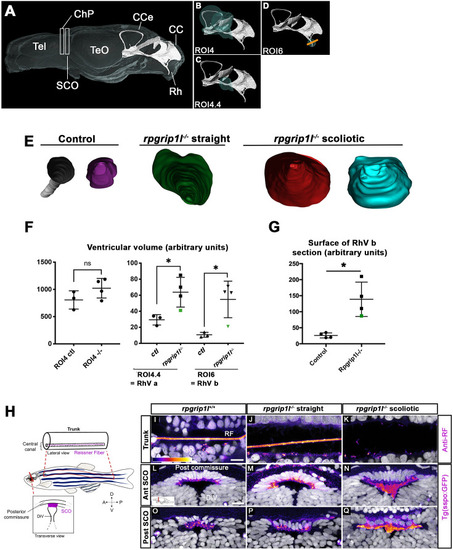
rpgrip1 -/- juveniles show ventricular dilations and loss of the Reissner Fiber at scoliosis onset. (A) Reconstruction of the RhV at the level of posterior midbrain and hindbrain in a transparised 5 wpf control zebrafish brain, stained with ZO1 antibody (ventricular surface) and DiI (global brain shape). Several brain regions are annotated on the reconstruction where Tel means telencephalon, ChP forebrain choroid plexus, SCO subcommissural organ, TeO optic tectum, CCe corpus cerebelli, CC crista cerebellaris and Rh rhombencephalon. (B–D) Cyan circles represent the ROIs measured in F. The orange line in D indicates the level of optical sections in E. (E) Optical transverse sections showing the caudal part of reconstructed ventricles of a control and two rpgrip1l-/- fish, one straight and two tail-up. (F) Graphs of the ventricle volume at the onset of scoliosis in three control and four rpgrip1l-/- (one straight and three tail-up) fish. The green dot corresponds to the straight mutant fish. Each dot represents a fish. Statistical analysis was performed using unpaired t-test where ns means non-significant, and * means p-value <0.05. (G) Graph of the surface of the optical sections as illustrated in E. The green dot corresponds to a straight mutant fish. Each dot represents a fish. Statistical analysis was performed using unpaired t-test where ns means non-significant, and * means p-value <0.05. (H) Schematic representation of a portion of the spinal cord central canal in a lateral view of the fish trunk, showing the Reissner Fiber (RF), and of the SCO in a transverse view of the brain at the level of diencephalic Ventricle (DiV). (I–Q) Visualization of the GFP fluorescence in the sspo-GFPuts24/+ transgenic line (fire LUT) in sagittal sections of the trunk (I–K) (N=3) and transverse sections of the brain at the level of the SCO (N=2) (L–Q) in juvenile fish. The corresponding fish are 8 wpf rpgrip1l+/+ (I, L, O) (n=10); straight rpgrip1l-/- (J, M, P) (n=9) and scoliotic rpgrip1l-/- (K, N, Q) (n=8). L-N and O-Q show sections at anterior and posterior SCO levels, respectively. Scale bars: 5 µm in I-K, 10 μm in L-Q.
|