|
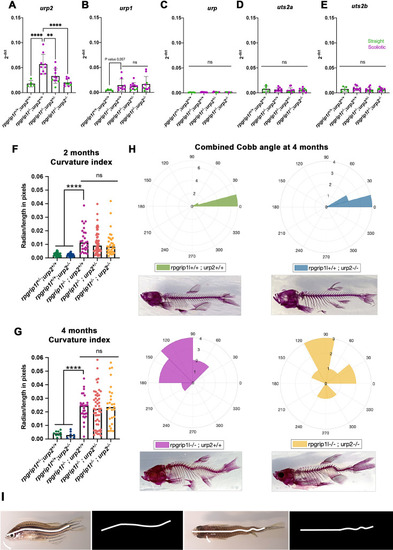
Genetic invalidation of urp2 in rpgrip1l-/- fish does not have any beneficial effect on scoliosis penetrance or severity. (A–E) Absence of compensatory upregulation of urp family members in urp2-/- fish. Expression levels of urp2 (A), urp1 (B), urp (C), uts2a (D) and uts2b (E) in zebrafish in 13 wpf adults. Each dot represents the value measured for one fish; green and purple dots represent straight and curved fish, respectively. n=5 [rpgrip1l+/+; urp2+/+], 9 [rpgrip1l+/+; urp2-/-], 11 [rpgrip1l-/-; urp2+/-] and 10 [rpgrip1l-/-; urp2-/-]. Expression levels for each gene are compared to the lsm12b housekeeping gene. Statistical analysis was performed using the Tukey test where ns means not significant, ** p<0.01, **** p<0.0001. Error bars represent s.d. None of the uts2 family members is significantly upregulated in [rpgrip1l-/-; urp2-/-] fish compared to rpgrip1l-/-, suggesting an absence of compensation. (F, G) Quantification of body axis curvature on dorsal and lateral positions at 2 (F) and 4 (G) mpf. Each dot represents the curvature index of one fish. Statistical analysis was done using Tukey’s multiple comparisons test where ****p<0.0001, with error bars representing s.d. At 2 mpf, n=30 [rpgrip1l+/+; urp2+/+], 26 [rpgrip1l+/+; urp2-/-], 27 [rpgrip1l-/-; urp2+/+], 55 [rpgrip1l-/-; urp2+/-] and 32 [rpgrip1l-/-; urp2-/-]. At 4 mpf, n=9 [rpgrip1l+/+; urp2+/+], 7 [rpgrip1l+/+; urp2-/-], 27 [rpgrip1l-/-; urp2+/+], 48 [rpgrip1l-/-; urp2+/-] and 27 [rpgrip1l-/-; urp2-/-]. (H) Rose plots representing combined Cobb angle measurements at 4 mpf of [rpgrip1l+/+; urp2+/+] (n=7) in green, [rpgrip1l+/+; urp2-/-] (n=6) in blue, [rpgrip1l-/-; urp2+/+] (n=10) in pink and [rpgrip1l-/-; urp2-/-] (n=7) in yellow. Cobb angle measurements were performed on Alizarin red fish skeletons. One example of Alizarin red skeletons for each genotype is presented below its corresponding rose-plot. (I) Illustration of combined curvature index measurement from traced lines on lateral (left) and dorsal (right) views of fish. The curvature index of both traced lines was measured using a modified MATLAB program (LineCurvature2D function) which provided a measurement in radian/length in pixels. .
|