|
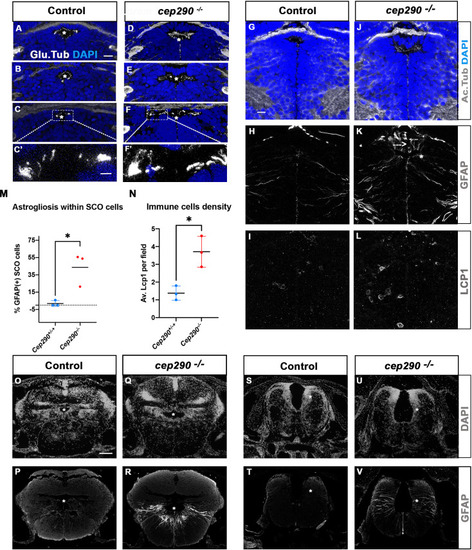
Altered ciliogenesis, GFAP upregulation and increased number of LCP1-positive cells around ventricles of cep290-/- juvenile fish at 4 wpf. (A-F’) Immunostaining of the cilia marker glutamylated tubulin (white) on 4 wpf brain transverse sections at 3 antero-posterior SCO levels in 4 wpf control (A-C’, n=3) and cep290-/- scoliotic (D-F’, n=3) fish. Nuclei are stained with DAPI (blue). White stars indicate the diencephalic ventricle (DiV), above which lies the SCO. White rectangles in C and F delineate the close-up on cilia (C’, F’). Scale bar: 10 µm for A-F, 2.5 µm for C’-F’. (G–L) Immunostaining for Acetylated Tubulin (G, J), GFAP (H, K) and LCP1 (I, L) on transverse sections of the brain at SCO level in controls (G–I) (n=3), and cep290-/- (J–L) (n=3) juvenile (4 wpf) fish. In G and J, nuclei are stained with DAPI (blue). Scale bar: identical to A-F. (M) Graph representing the percentage of GFAP-positive cells among the total number of SCO secretory cells in control (n=3) and scoliotic cep290-/- (n=3) fish at scoliosis onset (N=1). Each dot represents the mean ratio of GFAP-positive over total SCO secretory cells in 5–7 sections per fish. (N) Quantification of LCP1 + cell density around the SCO in controls (n=3) and curved cep290-/- (n=3) fish at 4 wpf. 16 sections were counted for control, 18 sections for cep290-/- scoliotic fish. Each dot represents the mean value for one fish. Statistical analysis was performed with unpaired T test where * means p-value < 0.05. Error bars represent s.d. (O–V) Immunostaining for GFAP (white) on brain transverse sections at cerebellum levels (P, R) and anterior hindbrain level (T, V) in control (P, T) (n=3), and cep290-/- (R, V) (n=3) fish. Corresponding nuclear staining (DAPI in white) is shown above (O, Q, S, U). Scale bar: 125 µm.
|