
|
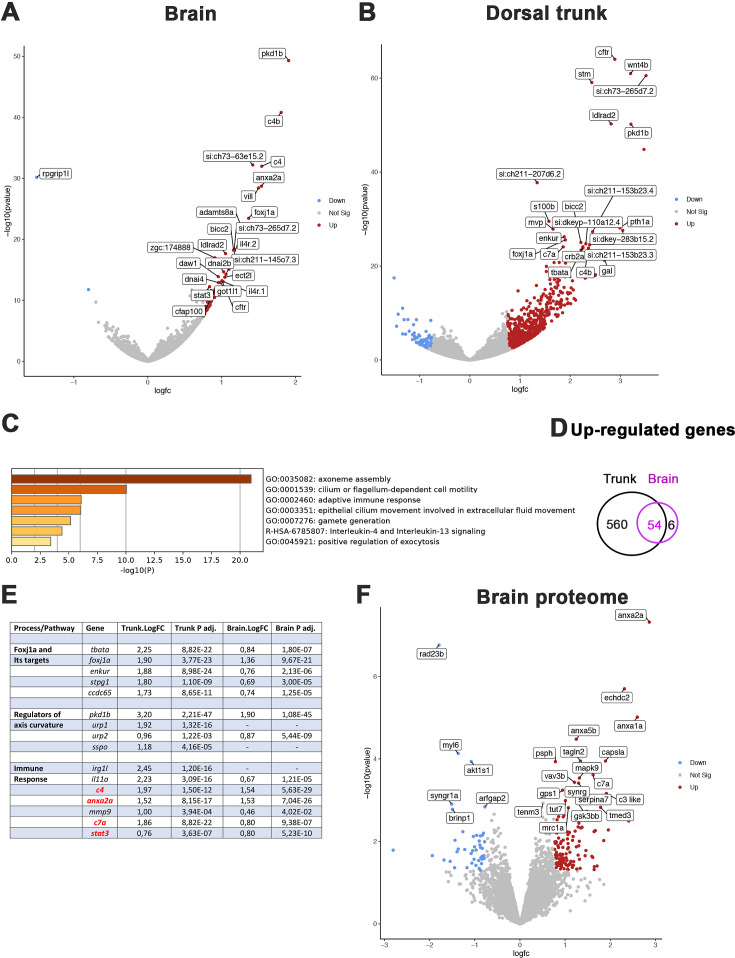
Figure 5 Comparative transcriptome and proteome analysis of control and rpgrip1l-/- fish. (A, B) Volcano-plots showing differentially regulated genes in the transcriptomes of the brain (A) and dorsal trunk (B) comparing 5 controls (2 wt, 3 rpgrip1l-/+) and 7 rpgrip1l-/- (6 tail-up and 1 straight) fish at 5 wpf (0.9 cm body length). Each dot corresponds to one gene. A gene was considered deregulated if its associated P-adj. value was inferior to 0.05. Red and blue dots represent up-regulated (Log2FC >0.75), and down-regulated (Log2FC <–0.75) genes, respectively. The names of the top 25 most deregulated genes are boxed. (C) GO term analysis of biological processes in the brain samples using Metascape. (D) Venn diagram of the upregulated genes in brain and trunk samples, showing many common genes between the two regions. (E) Selected genes of interest upregulated in the trunk and/or brain of rpgrip1l-/- fish. The four genes in red were also found upregulated in the proteome of adult rpgrip1l-/- fish. (F) Volcano-plot showing differentially expressed proteins in the brain of 5 rpgrip1l+/+ fish versus 5 rpgrip1l-/- adult scoliotic fish (3 months pf). Each dot corresponds to one protein. A protein was considered differentially expressed if its associated P-adj. value was inferior to 0.05. Red and blue dots represent proteins enriched (Log2FC >0.75) or depleted (Log2FC <–0.75) in mutant brains, respectively. The names of the top 25 most differentially expressed proteins are boxed.