
|
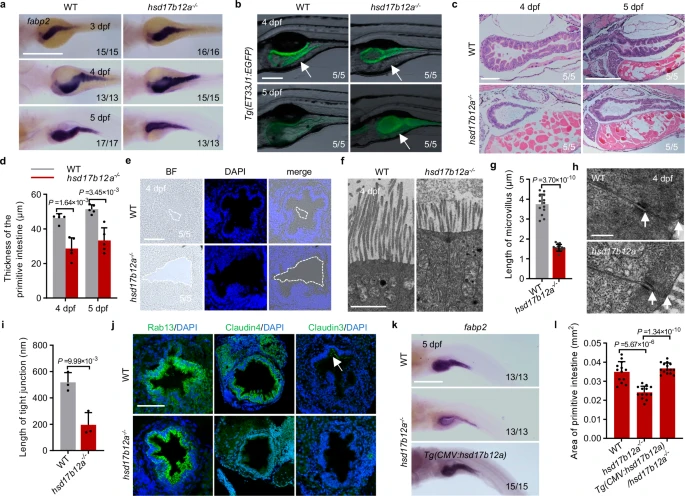
Fig. 4 The primitive intestinal structures exhibit defects.a Intestinal development was examined using whole-mount in situ hybridization in both WT and hsd17b12a−/− at 3 dpf, 4 dpf, and 5 dpf (n > 3). Scale bar, 200 μm. b Intestinal fluorescence imaging of WT and hsd17b12a−/− (n = 5). The white arrows indicate the yolk region. Scale bar, 200 μm. c HE staining of paraffin sections of the intestine in hsd17b12a−/− and WT at 4 dpf and 5 dpf (n = 5). Scale bar, 100 μm. d The thickness of the primitive intestine was quantified in WT and hsd17b12a−/− at 4 dpf and 5 dpf. e Confocal imaging of the intestine in WT and hsd17b12a−/− at 4 dpf (n = 5). The white dotted line indicates the intestinal lumen. Scale bar, 100 μm. f, g Transmission electron microscopy micrographs (TEM) (n > 3) and quantification of the intestinal microvilli length in WT and hsd17b12a−/− at 4 dpf. Scale bar, 0.5 μm. h, i TEM micrographs (n = 3) and quantification of the intestinal tight junction length in WT and hsd17b12a−/− at 4 dpf. The white arrows indicate the tight junctions. Scale bar, 0.5 μm. j Immunofluorescence staining of proteins associated with tight junction formation in the intestine of WT and hsd17b12a−/− at 4 dpf (n = 3). Scale bar, 50μm. k Tg(CMV:hsd17b12a) rescued the expansion defects of primitive intestine in hsd17b12a−/− (n ≥ 3). Scale bar, 0.5 mm. l The area of the primitive intestine was quantified by the signal of fabp2 in WT, hsd17b12a−/− and Tg(CMV:hsd17b12a)/hsd17b12a−/−. Data in d, j, i, l are represented as mean ± S.D., using a two-tailed Student’s t test; each point represents an independent biological sample (n ≥ 3). Source data are provided as a Source Data file.