
- Title
-
Intestinal DHA-PA-PG axis promotes digestive organ expansion by mediating usage of maternally deposited yolk lipids
- Authors
- Chen, Z., He, M., Wang, H., Li, X., Qin, R., Ye, D., Zhai, X., Zhu, J., Zhang, Q., Hu, P., Shui, G., Sun, Y.
- Source
- Full text @ Nat. Commun.
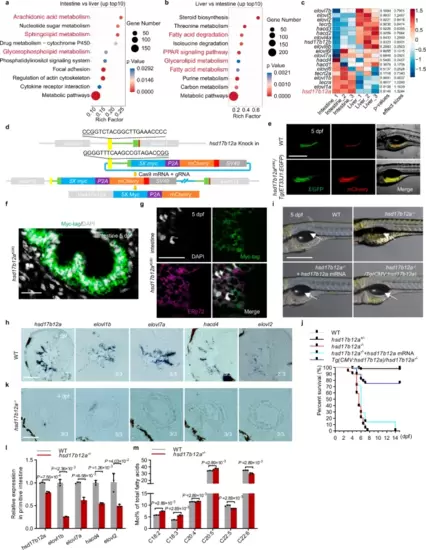
LC-PUFA synthesis facilitates the embryo-to-larval transition.a KEGG pathway analysis of genes highly expressed in intestine compared to liver at 5 dpf (p-value < 0.05). b KEGG pathway analysis of genes highly expressed in liver compared to intestine at 5 dpf (p-value < 0.05). c The heatmap illustrates enzyme expression related to long-chain polyunsaturated fatty acid (LC-PUFA) synthesis in the liver and intestine of WT at 5 dpf, showing p-values and effect sizes (n = 3) d Schematic of the knock-in strategy for inserting 5×Myc-P2A-mCherry into the hsd17b12a locus using CRISPR/Cas9. e The mCherry signal, confirmed not to be autofluorescence, co-localizes with the EGFP signal in the intestine-specific transgenic fish Tg(ET33J1:EGFP) at 5 dpf (n > 3). Scale bar, 200 μm. f Immunofluorescence staining of the intestine in hsd17b12aKI/KI using a Myc-tag antibody at 5 dpf (n = 3). Nuclei stained with DAPI. Scale bar, 200 μm. g Immunofluorescence staining of the intestine in hsd17b12aKI/KI using Myc-tag and ERp72 (ER) antibodies at 5 dpf (n = 3). Nuclei stained with DAPI. Scale bar, 200 μm. h Expression of genes related to LC-PUFA synthesis in WT at 4 dpf was detected using section in situ hybridization (n = 3). Scale bar, 50 μm. i Overexpression of hsd17b12a rescued the swim bladder inflation defect (n > 3). The arrows indicate the location of the swim bladder. Scale bar, 500 μm. j Survival curves were plotted for WT, hsd17b12a+/−, hsd17b12a−/−, hsd17b12a−/− with hsd17b12a mRNA, and Tg(CMV:hsd17b12a)/hsd17b12a−/−, respectively. k Expression of genes related to LC-PUFA synthesis in hsd17b12a−/− at 4 dpf was detected using section in situ hybridization (n = 3). Scale bar, 50 μm. l Expression of genes related to LC-PUFA synthesis in the primitive intestine was quantified by RT-PCR in WT and hsd17b12a−/− at 4 dpf. m Differential analysis of relative amounts of total FAs (fatty acids) in hsd17b12a−/− larvae compared to WT at 4 dpf. Data in l, m are represented as mean ± S.D., using a two-tailed Student’s t test; each point represents an independent biological sample (n = 3). Source data are provided as a Source Data file. |
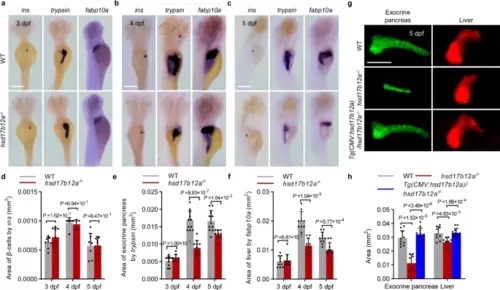
Disrupting Hsd17b12a results in organ expansion defects.a–c The development of the endocrine pancreas, exocrine pancreas, and liver was examined using WISH (whole-mount in situ hybridization) at 3 dpf, 4 dpf, and 5 dpf in both WT and hsd17b12a−/− (n > 3). Scale bar, 200 μm. d–f The areas of β-cells (ins), exocrine pancreas (trypsin), and liver (fabp10a) were measured in WT and hsd17b12a−/− embryos at 3 dpf, 4 dpf and 5 dpf. g Fluorescence images of exocrine pancreas and liver in WT, hsd17b12a−/−, and Tg (CMV: hsd17b12a)/hsd17b12a−/− at 5 dpf (n > 3). Scale bar, 200 μm. h The areas of images of the liver and exocrine pancreas were quantified in WT, hsd17b12a−/− and Tg(CMV:hsd17b12a)/hsd17b12a−/−. Data in d–f, h are represented as mean ± S.D., using a two-tailed Student’s t test; each point represents an independent ±biological sample (n > 3). Source data are provided as a Source Data file. |
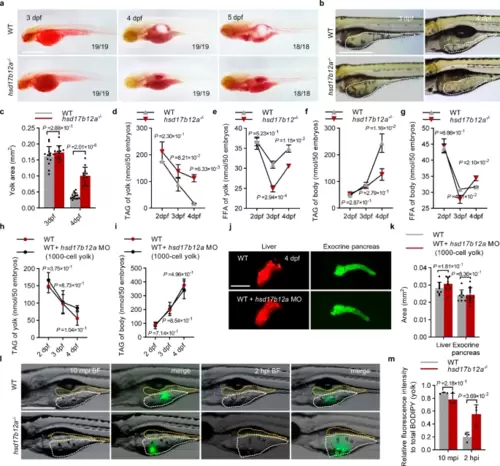
Malabsorption of yolk lipids results in expansion defectsa ORO (Oil Red O) staining was performed on embryos of WT and hsd17b12a−/− at 3 dpf, 4 dpf, and 5 dpf (n > 3). Scale bar, 0.5 mm. b Images of yolk in WT and hsd17b12a−/− at 3 dpf and 4 dpf. The white dotted line indicates the yolk region (n > 3). Scale bar, 1 mm. c Quantification of the area of the yolk in WT and hsd17b12a−/− at 3 dpf and 4 dpf. d–g The body and yolk of WT and hsd17b12a−/− were isolated at 2 dpf, 3 dpf, and 4 dpf, and the TAG (triglyceride) and FFA (free fatty acid) levels in the body and yolk were detected. h, i TAG content in the yolk and body of embryos with suppressed expression of YSL hsd17b12a was measured at 2 dpf, 3 dpf, and 4 dpf. j, k Fluorescence imaging of the liver and exocrine pancreas at 4 dpf in WT and WT with suppressed YSL hsd17b12a expression (n > 3), and quantification of the liver and exocrine pancreas. Scale bar, 500 μm. l Assessment of lipid transport by injection of BODIPY FL C12 (green) into the yolk in WT and hsd17b12a−/− at 4 dpf (n = 3). Images were captured at 10 mpi (10 min post-injection) and 2 hpi (2 h post-injection). The orange dotted line indicates intestinal lumen. The white dotted line indicates the region of yolk. Scale bar, 0.5 mm. m Relative analysis of the fluorescence intensity in the yolk compared to the total fluorescence (BODIPY) intensity (0 mpi) in the yolk at 10 mpi and 2 hpi. Data in d–i are presented as mean ± S.D., using a two-tailed Student’s t-test; n ≥ 3. Data in c, k, m are represented as mean ± S.D., using a two-tailed Student’s t test; each point represents an independent biological sample (n ≥ 3). Source data are provided as a Source Data file.. |
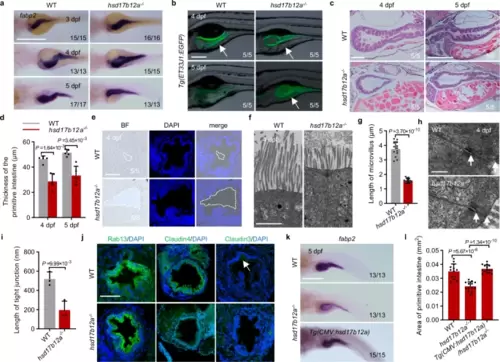
The primitive intestinal structures exhibit defects.a Intestinal development was examined using whole-mount in situ hybridization in both WT and hsd17b12a−/− at 3 dpf, 4 dpf, and 5 dpf (n > 3). Scale bar, 200 μm. b Intestinal fluorescence imaging of WT and hsd17b12a−/− (n = 5). The white arrows indicate the yolk region. Scale bar, 200 μm. c HE staining of paraffin sections of the intestine in hsd17b12a−/− and WT at 4 dpf and 5 dpf (n = 5). Scale bar, 100 μm. d The thickness of the primitive intestine was quantified in WT and hsd17b12a−/− at 4 dpf and 5 dpf. e Confocal imaging of the intestine in WT and hsd17b12a−/− at 4 dpf (n = 5). The white dotted line indicates the intestinal lumen. Scale bar, 100 μm. f, g Transmission electron microscopy micrographs (TEM) (n > 3) and quantification of the intestinal microvilli length in WT and hsd17b12a−/− at 4 dpf. Scale bar, 0.5 μm. h, i TEM micrographs (n = 3) and quantification of the intestinal tight junction length in WT and hsd17b12a−/− at 4 dpf. The white arrows indicate the tight junctions. Scale bar, 0.5 μm. j Immunofluorescence staining of proteins associated with tight junction formation in the intestine of WT and hsd17b12a−/− at 4 dpf (n = 3). Scale bar, 50μm. k Tg(CMV:hsd17b12a) rescued the expansion defects of primitive intestine in hsd17b12a−/− (n ≥ 3). Scale bar, 0.5 mm. l The area of the primitive intestine was quantified by the signal of fabp2 in WT, hsd17b12a−/− and Tg(CMV:hsd17b12a)/hsd17b12a−/−. Data in d, j, i, l are represented as mean ± S.D., using a two-tailed Student’s t test; each point represents an independent biological sample (n ≥ 3). Source data are provided as a Source Data file. |
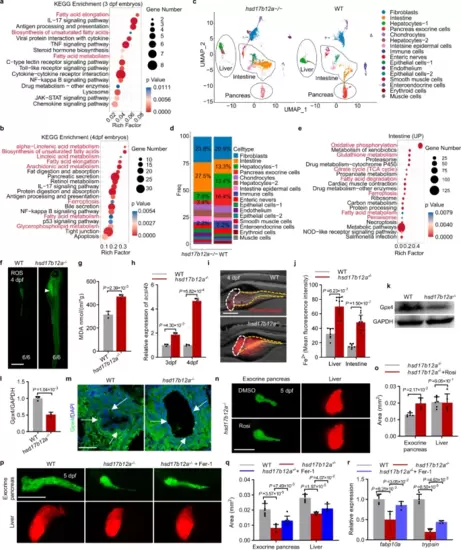
Ferroptosis hinders the digestive organ expansion.a, b KEGG pathway analysis of differentially expressed genes in hsd17b12a−/− compared to WT at 3 dpf and 4 dpf (p-value < 0.05). c Single-cell sequencing analysis of the liver, intestine, and pancreas in hsd17b12a−/− and WT at 4 dpf. The “Liver” label indicates liver-origin cells, the “Pancreas” label indicates pancreas-origin cells, and the “Intestine” label indicates intestinal-origin cells. d The proportions of each cell type in hsd17b12a−/− and WT. e KEGG pathway analysis of differentially expressed genes in the intestine of hsd17b12a−/− compared to WT (p-value < 0.05). f Detection of ROS (reactive oxygen species) in WT and hsd17b12a−/− at 4 dpf (n = 6). The white arrowheads indicate the intestine. Scale bar, 0.5 mm. g MDA (malondialdehyde) levels were measured in WT and hsd17b12a−/− at 4 dpf. h RT-qPCR of acsl4a and acsl4b in WT and hsd17b12a−/− at 3 dpf and 4 dpf. i, j Assessment and quantification of intracellular Fe2+ levels in larvae using FerroOrange probe in WT and hsd17b12a−/− at 4 dpf (n > 3). k, l Evaluation of GPX4 protein levels in WT and hsd17b12a−/− by western blot and quantification of GPX4 relative to GAPDH (n = 3). m Immunofluorescence analysis of GPX4 protein in the primitive intestine of WT and hsd17b12a−/− at 4 dpf (n = 3). The white arrows indicate the intestinal epithelia. Scale bar: 25 μm. n Fluorescence imaging of the liver and exocrine pancreas in hsd17b12a−/− treated with the Acsl4 inhibitor Rosi (rosiglitazone) (n > 3). o Measurement of the exocrine pancreas and liver areas in both untreated and Rosi-treated hsd17b12a−/−. Scale bar: 250 μm. p, q Fluorescence imaging and quantification of the exocrine pancreas and liver areas in WT, hsd17b12a−/−, and Fer-1 (Ferrostatin-1)-treated hsd17b12a−/− at 5 dpf (n > 3). Scale bar: 200 μm. r RT-PCR of fabp10a and trypsin at 5 dpf after treatment with Fer-1. Data in g, h, j, l, o, q, r are represented as mean ± S.D., using a two-tailed Student’s t test; each point represents an independent biological sample (n ≥ 3). Source data are provided as a Source Data file. |
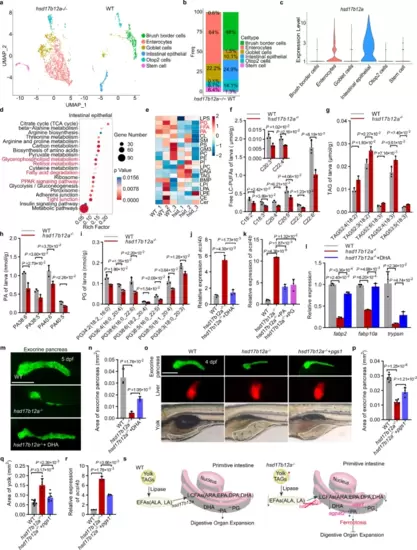
PG inhibits ferroptosis and promotes organ expansion.a UMAP analysis classified the intestines of hsd17b12a−/− and WT. b Proportional statistics of the six intestinal cell types in hsd17b12a−/− and WT. c Violin plots showing hsd17b12a expression profiles in six intestinal cell types. d Identification of enriched pathways for highly expressed genes in intestinal epithelial cells (p-value < 0.05). e Heatmap depicting changes in lipid components in WT and hsd17b12a−/− larvae at 4 dpf (n = 3). f Differential analysis of free LC-PUFAs (long-chain polyunsaturated fatty acids) in hsd17b12a−/− larvae compared to WT at 4 dpf. g Differential analysis of TAGs (triglycerides) containing C18:2 or C18:3 in hsd17b12a−/− larvae compared to WT at 4 dpf. h, i Differential analysis of PA (phosphatidic acid) and PG (phosphatidylglycerol) in hsd17b12a−/− larvae compared to WT at 4 dpf. j, k RT-PCR analysis of acsl4b gene expression at 5 dpf after DHA (docosahexaenoic acid), PA, and PG immersion treatments. l RT-PCR analysis of fabp2, fabp10a, and trypsin expression in WT, hsd17b12a−/−, and DHA-immersed hsd17b12a−/− at 5 dpf. m, n Images and quantification of the exocrine pancreas areas in WT, hsd17b12a−/−, and DHA-immersed hsd17b12a−/− at 5 dpf (n = 3). Scale bar, 200 μm. o Overexpression of pgs1 rescued exocrine pancreatic expansion defects and facilitated yolk utilization in hsd17b12a−/− (n > 3). Scale bar, 250 μm. p, q Quantification of exocrine pancreas area and yolk area at 4 dpf. Yolk area highlighted with a white dotted line. r RT-PCR analysis of acsl4b gene expression at 4 dpf following pgs1 overexpression. s Model of the DHA-PA-PG axis in the primitive intestine regulating digestive organ expansion. In hsd17b12a−/−, the LC-PUFA synthesis is blocked, leading to TAG accumulation in the yolk, decreased LC-PUFA and LC-PUFA-containing phospholipids, further resulting in ferroptosis and defective digestive organ expansion. The red arrows indicate increased content, while the blue arrows indicate decreased content. Data in f–l, n, p, q, r are represented as mean ± S.D., using a two-tailed Student’s t test; each point represents an independent biological sample (n ≥ 3). Source data are provided as a Source Data file. |