
Fig. 3
|
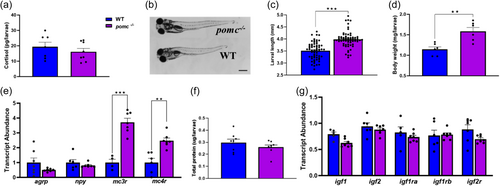
Fig. 3 Lack of Pomca enhances postnatal growth. (a) No significant changes in total cortisol were observed between WT and KO groups at 15 dpf (n = 7–8, each a pool of 6–8 larvae); (b) Representative images of the WT and pomc-/- larvae showing the difference in length at 15 dpf (bar is 0.20 mm; (c) Bars represent significant increase in larval length in the pomc-/- larvae compared to WT at 15 dpf (n = 60–66 individual larvae, t test, ***p < 0.001); (d) Larval weight at 15 dpf were higher among the pomc-/- fish compared to WT (n = 6, each a pool of 4 to 8 larvae, t test, **p < 0.001); (e) Graph showing the transcript abundance of feeding regulatory transcripts, including agrp, npy, mc3r and mc4r in WT and KO larvae at 15 dpf. Significant differences between the two groups (t test, n = 5–7, each a pool of 5–8 larvae, **p < 0.01, ***p < 0.001); (f) No significant changes in the total protein content between WT and pomc-/- larvae at 15 dpf (n = 8, each n composed of 6–8 larvae per group); G) Transcript abundance of igf1, igf2, igf1ra, igf1rb and igf2r were not affected by Pomca loss in zebrafish larvae (n = 5–7, each a pool of 5–8 larvae. The transcript abundance, cortisol, body weight and total protein levels are from whole larvae.