
- Title
-
Mineralocorticoid receptor activates postnatal adiposity in zebrafish lacking proopiomelanocortin
- Authors
- Rajeswari, J.J., Faught, E., Santos, H., Vijayan, M.M.
- Source
- Full text @ J. Cell. Physiol.

Lack of Pomca reflects interrenal insufficiency. (a) Schematics of the Pomca knockout (pomc-/-) showing the 14 bp deletion (red letters) in the exon 3 of the Pomca gene. The white box on either end represents the 5??3? upstream and downstream sequences, respectively, and the introns are represented as black lines and exons as a black box; (b) Anatomical view of wildtype, and pomc-/- larvae at 6 days post-fertilization (dpf) showing where the histological sections were obtained for identification of the hypothalamus and pituitary regions. The top panel shows the cross-section of brains stained with hematoxylin and eosin (I and II) and the bottom panels are immunostained for Acth (III and IV) and a-Msh (V and VI); Tectum (Tt), tegmentum (Tg) and hypothalamus (Hp). White arrows indicate Acth- and a-Msh-positive cells. Asterisk (*) denotes the cranial cavity. The rectangle in the insert indicates the hypothalamic and pituitary regions that were magnified. I?II (bar 20 ?m), III?VI (bar 10 ?m) and Insert (bars 40 ?m). The Acth and a-Msh immunoreactivity is absent in the pomc-/- larvae; (c) Representative image of 6 dpf larva showing reduced pigmentation in the pomc-/- larvae (arrowhead) compared to WT (left panel); (d) Quantification of larval pigmentation between the genotypes at 6 dpf (t test, n = 20 larvae per group, ***p < 0.001); (e)The acute cortisol response to a physical stressor (1 min at 250 rpm) was inhibited in the 4 dpf pomc-/- larvae (symbols with different letters are significantly different (2-way ANOVA; n = 8?12, each a pool of 12 larvae); (f) bars represent significant differences in the transcript abundance of mc2r, star, p450ssc, nr3c1, nr3c2, and hsd11b2 in WT and pomc-/- larvae at 6 dpf (t test, n = 6?7, each a pool of 12 larvae, *p < 0.05, **p < 0.01, ***p < 0.001); (g) Anatomical view of wildtype and pomc-/- larvae at 6 dpf showing glucocorticoid receptor (Gr) and mineralocorticoid receptor (Mr) immunoreactivity in the control (i and iii and ii and iv) and cortisol (v and vii and vi and viii) treated groups in the hypothalamus. The panel on the left side shows the anatomy and cross-section of the body stained with Hematoxylin and Eosin (H&E) and the area inside the box indicate where the zoomed images of the brain were acquired to evaluate the immunostaining for Gr and Mr expression (white arrows and *); (h) Cross-section of WT (i, iii, v and vii) and pomc-/- (ii, iv, vi and viii) larvae liver at 6 dpf showing Gr and Mr immunoreactivity with and without cortisol treatment. The panel on the left side shows the anatomy and cross-section of the body stained with H&E to indicate where the zoomed images of the liver were acquired to evaluate the immunostaining for Gr and Mr expression; white arrows indicate Gr- and Mr-positive hepatocytes; spinal cord (SC), notochord (N), muscles (M), head kidney (HK), anterior intestine (I), yolk sac (YS) and liver (L). Bars: 10 �m (i?viii) and 50 �m for the trunk stained with H&E. The transcript abundance and cortisol levels are from whole larvae. |
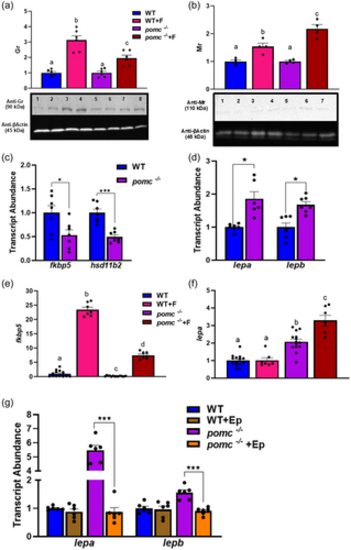
Lack of Pomca increases postnatal mineralocorticoid receptor (Mr) responsiveness. (a) Representative Western blot of 6 dpf larvae showing glucocorticoid receptor (Gr) protein expression (~90 kDa: lanes 1?2 WT, lanes 3?4 WT + F (cortisol), lanes 5?6 pomc-/-, Lanes 7?8 pomc-/- + F). The original unprocessed blot images are shown in the supplemental file (Supporting Information S1: Figure S2). The lower blot shows b-actin expression as a loading control. The bar graph below represents the semi-quantitative image of the Gr band intensity (n = 6, each a pool of 12 larvae, bars with different letters are significantly different, one-way ANOVA, p < 0.05); (b) Representative Western blot of 6 dpf larvae showing Mr protein expression (~110 kDa: lane 1 WT, lanes 2?3 WT + F, lanes 4?5 pomc-/-, lanes 6?7 pomc-/-+ F). The lower blot shows ?-actin expression as a loading control. The bar graph shows below represents the semi-quantitative image of the Mr band intensity (n = 4, each a pool of 12 larvae, bars with different letters are significantly different, one-way ANOVA, p < 0.05); (c) Shows the transcript abundance of Gr-responsive genes, fkbp5 and hsd11b2 in 6 dpf WT and pomc-/- larvae. Bars with asterisk (*) are significantly different (t test, *p < 0.05 and ***p < 0.001, n = 6?7, each a pool of 12 larvae); (d) Represent the transcript abundance of Mr-responsive genes, lepa and lepb in 6 dpf WT and pomc-/- larvae. Bars with asterisk (*) are significantly different (t test, *p < 0.05, n = 6-7, each a pool of 12 larvae); (e) Shows the transcript abundance of Gr-responsive gene fkbp5 either without or with cortisol (F) and (f) Shows the transcript abundance of Mr-responsive gene lepa either without or with cortisol (F) in 6 dpf WT and pomc-/- larvae; bars with different letters are significantly different (one-way ANOVA, p < 0.05, n = 7?14, each a pool of 12 larvae); (g) Shows the transcript abundance of Mr-responsive genes, lepa and lepb following eplerenone (Ep) treatment in WT and pomc-/- fish at 6 dpf (t test, n = 5?7, each a pool of 5?8 larvae, ***p < 0.001). The transcript abundance and Western blot results are from the whole larvae. |
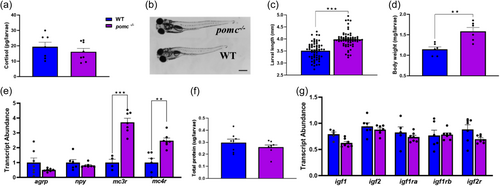
Lack of Pomca enhances postnatal growth. (a) No significant changes in total cortisol were observed between WT and KO groups at 15 dpf (n = 7?8, each a pool of 6?8 larvae); (b) Representative images of the WT and pomc-/- larvae showing the difference in length at 15 dpf (bar is 0.20 mm; (c) Bars represent significant increase in larval length in the pomc-/- larvae compared to WT at 15 dpf (n = 60?66 individual larvae, t test, ***p < 0.001); (d) Larval weight at 15 dpf were higher among the pomc-/- fish compared to WT (n = 6, each a pool of 4 to 8 larvae, t test, **p < 0.001); (e) Graph showing the transcript abundance of feeding regulatory transcripts, including agrp, npy, mc3r and mc4r in WT and KO larvae at 15 dpf. Significant differences between the two groups (t test, n = 5?7, each a pool of 5?8 larvae, **p < 0.01, ***p < 0.001); (f) No significant changes in the total protein content between WT and pomc-/- larvae at 15 dpf (n = 8, each n composed of 6?8 larvae per group); G) Transcript abundance of igf1, igf2, igf1ra, igf1rb and igf2r were not affected by Pomca loss in zebrafish larvae (n = 5?7, each a pool of 5?8 larvae. The transcript abundance, cortisol, body weight and total protein levels are from whole larvae. |

Lack of Pomca enhances postnatal adiposity. (a) Nile red staining shows lipid deposition in different regions, including abdominal visceral (AV; i and ii), pancreatic visceral (PV; iv and v), appendicular loose (AL; vii and viii), and abdominal truncal (AT; x and xi) in the 15 dpf WT and pomc-/- larvae, and the corresponding quantification as relative fluorescence units (RFU) are shown as histogram next to the panels (iii, vi, ix, and xii; t test, n = 5?6 larvae; ***p < 0.001); (b) bar graph represent triglyceride levels at 15 dpf in WT and pomc-/- larvae (n = 7, each a pool of 8?12 larvae; t test, ***p < 0.001); (c) Glycerol levels are elevated in the 15 dpf pomc-/- larvae compared to the WT larvae (n = 7, each a pool of 8?12 larvae; t test, **p < 0.01); (d) Shows the transcript abundance of lpl, fasn, elovl2, dgat, and pparg at 15 dpf in the pomc-/- and WT larvae; significant difference between the two groups (t test) are shown as *p < 0.05. The transcript abundance and metabolite levels are from whole larvae. |

Pomc-induced adiposity is mineralocorticoid receptor (Mr) mediated. To test if the adiposity phenotype in pomc-/- larvae is due to enhanced Mr responsiveness, both WT and pomc-/- larvae were treated with eplerenone (Ep) for 9 days (5 �g/mL; replenished 50% daily) from day 6 and sampled at 15 dpf. The WT and pomc-/- without Ep were set as 100% to indicate the percent change due to Ep treatment in both the genotypes. (a) Bar graph showing percent change in the transcript abundance of lepa and lepb following Ep treatment in WT and pomc-/- larvae (t test, n = 4?7, each a pool of 5?8 larvae, *p < 0.05); (b) Shows the percent change in length following Ep treatment for 9 days (t test, n = 15?24 larvae; ***p < 0.0001); (c) Represent percent change in body weight in both WT and pomc-/- larvae following Ep treatment (t test, n = 6, 5?7 larvae per group; ***p < 0.0001); (d) Shows the percent change in total triglycerides post Ep treatment in WT and pomc-/- larvae at 15 dpf (t test, n = 6, 5?7 larvae per group; *p < 0.05); (e) Bars represent the percent change in whole larval glycerol content in WT and pomc-/- larvae at 15 dpf following a 9 day Ep treatment (t test, n = 6, 5?7 larvae per group; *p < 0.05); (f) Percentage change in the transcript abundance of pparg following Ep treatment (n = 6?7, each a pool of 5?7 larvae, **p < 0.001); (g) Percentage change in the transcript abundance of lpl following Ep treatment (n = 6?7, each a pool of 5?7 larvae, **p < 0.001). The transcript abundance and metabolite changes are from the whole larvae. |
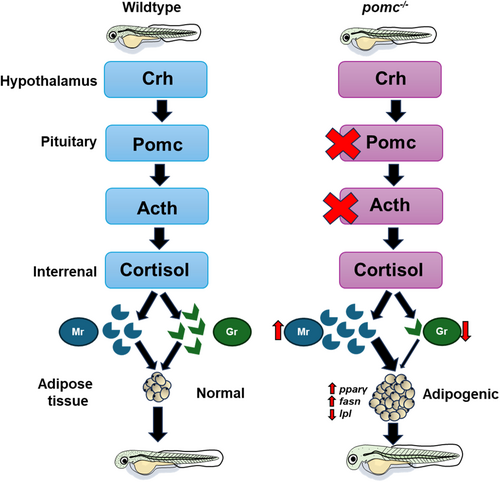
Schematic representation of Mr activation as a possible peripheral mechanism leading to adiposity in Pomc mutants. The left panel shows the hypothalamus-pituitary-interrenal (HPI) axis function in the wildtype larvae leading to normal growth post-feeding. The right panel shows that the loss of Pomc leads to a lack of Acth and this leads to a reduced Gr responsiveness and an enhanced Mr responsiveness, which regulates adipogenic genes, including pparg, lpl and fasn, leading to adiposity. Acth, Adrenocorticotropic hormone; Crh, Corticotropin-releasing hormone; fasn, Fatty acid synthase; Gr, Glucocorticoid receptor; lpl, Lipoprotein lipase; Mr, Mineralocorticoid receptor; Pomc, Proopiomelanocortin; ppary, Peroxisome proliferator-activated receptor gamma. |