
Fig. 4
|
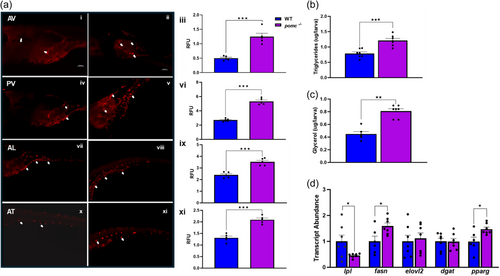
Fig. 4 Lack of Pomca enhances postnatal adiposity. (a) Nile red staining shows lipid deposition in different regions, including abdominal visceral (AV; i and ii), pancreatic visceral (PV; iv and v), appendicular loose (AL; vii and viii), and abdominal truncal (AT; x and xi) in the 15 dpf WT and pomc-/- larvae, and the corresponding quantification as relative fluorescence units (RFU) are shown as histogram next to the panels (iii, vi, ix, and xii; t test, n = 5–6 larvae; ***p < 0.001); (b) bar graph represent triglyceride levels at 15 dpf in WT and pomc-/- larvae (n = 7, each a pool of 8–12 larvae; t test, ***p < 0.001); (c) Glycerol levels are elevated in the 15 dpf pomc-/- larvae compared to the WT larvae (n = 7, each a pool of 8–12 larvae; t test, **p < 0.01); (d) Shows the transcript abundance of lpl, fasn, elovl2, dgat, and pparg at 15 dpf in the pomc-/- and WT larvae; significant difference between the two groups (t test) are shown as *p < 0.05. The transcript abundance and metabolite levels are from whole larvae.