
|
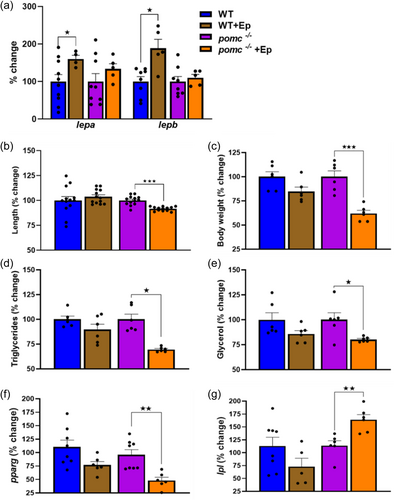
Fig. 5 Pomc-induced adiposity is mineralocorticoid receptor (Mr) mediated. To test if the adiposity phenotype in pomc-/- larvae is due to enhanced Mr responsiveness, both WT and pomc-/- larvae were treated with eplerenone (Ep) for 9 days (5 µg/mL; replenished 50% daily) from day 6 and sampled at 15 dpf. The WT and pomc-/- without Ep were set as 100% to indicate the percent change due to Ep treatment in both the genotypes. (a) Bar graph showing percent change in the transcript abundance of lepa and lepb following Ep treatment in WT and pomc-/- larvae (t test, n = 4–7, each a pool of 5–8 larvae, *p < 0.05); (b) Shows the percent change in length following Ep treatment for 9 days (t test, n = 15–24 larvae; ***p < 0.0001); (c) Represent percent change in body weight in both WT and pomc-/- larvae following Ep treatment (t test, n = 6, 5–7 larvae per group; ***p < 0.0001); (d) Shows the percent change in total triglycerides post Ep treatment in WT and pomc-/- larvae at 15 dpf (t test, n = 6, 5–7 larvae per group; *p < 0.05); (e) Bars represent the percent change in whole larval glycerol content in WT and pomc-/- larvae at 15 dpf following a 9 day Ep treatment (t test, n = 6, 5–7 larvae per group; *p < 0.05); (f) Percentage change in the transcript abundance of pparg following Ep treatment (n = 6–7, each a pool of 5–7 larvae, **p < 0.001); (g) Percentage change in the transcript abundance of lpl following Ep treatment (n = 6–7, each a pool of 5–7 larvae, **p < 0.001). The transcript abundance and metabolite changes are from the whole larvae.