
Image
|
Figure Caption
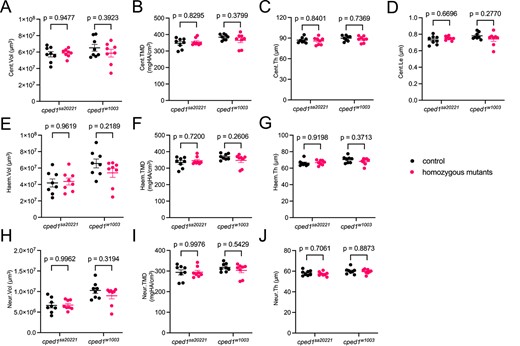
Fig. 4 Loss of cped1 does not affect vertebral bone mass and morphology in multiple mutant lines. (A-J) Combined analysis of vertebral measurements for cped1sa20221 and cped1w1003 mutants compared to their respective wildtype clutchmates. Each point represents a single fish, and the value is the average of 16 measured vertebrae. Bars indicate mean ± SEM. Shown are p-values from Sidak’s multiple comparisons tests; no significant p-values for comparisons between homozygous mutants and respective controls were observed.
Figure Data
Acknowledgments
This image is the copyrighted work of the attributed author or publisher, and
ZFIN has permission only to display this image to its users.
Additional permissions should be obtained from the applicable author or publisher of the image.
Full text @ JBMR Plus