
- Title
-
Loss of cped1 does not affect bone and lean tissue in zebrafish
- Authors
- Alvarado, K., Tang, W.J., Watson, C.J., Ahmed, A.R., Gómez, A.E., Donaka, R., Amemiya, C., Karasik, D., Hsu, Y.H., Kwon, R.Y.
- Source
- Full text @ JBMR Plus
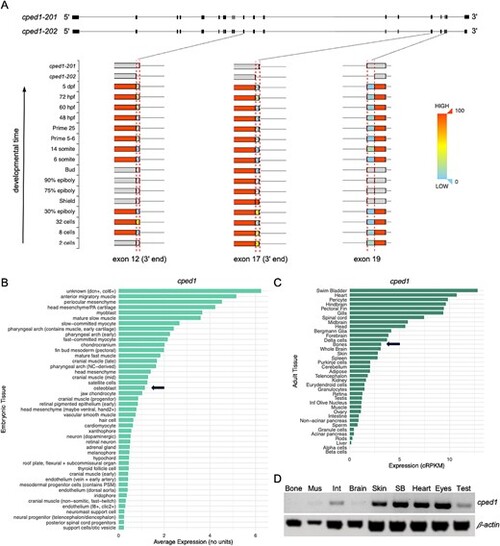
Characterization of cped1 expression. (A) Alternative splicing events for cped1. Top: exon-intron maps for the two cped1 transcript isoforms. Bottom: closeup views of exons 12, 17, and 19 show regions of these exons that vary in usage (denoted by the dotted red lines). The top two rows show how these exon regions differ between the two cped1 transcript isoforms. The remaining rows show these exon regions at various stages of zebrafish development, from 2 cell stage up to 5 dpf, and are colored by usage, eg, red indicates 100% usage in the exon, blue indicates 0% usage in the exon. Gray indicates no transcript evidence was detected at the specified developmental stage. Images for the three exonic regions were obtained from the MeDAS database,40 cropped, and assembled into a single image. (B and C) Bar plots showing average cped1 expression in multiple cell/tissue types. (B) cped1 expression in zebrafish embryos/larvae, from the zebrafish scRNA-seq dataset published in28. The top 45 cell populations with the highest cped1 expression are shown. Osteoblasts are highlighted by an arrow. (C) cped1 expression in adult zebrafish, as reported in the VASTDB database.41 Bone is highlighted by an arrow. (D) RT-PCR for cped1 expression in tissues from wildtype adult fish. Primers amplified a region spanning exons 14 through 16. Amplification of β-actin2 was performed in parallel and served as a loading control. Bone, vertebral bone; Brain: whole brain; dpf, days post fertilization; Int, intestine; Mus, muscle; SB, swim bladder, Test, testes. EXPRESSION / LABELING:
|
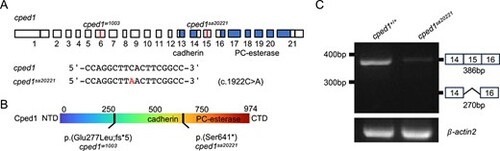
Characterization of the cped1sa20221 allele. (A) Sequence and genomic location of sa20221. Blue highlighted regions indicate the locations of the exonic regions encoding for the cadherin-like domain and PC-esterase domain. (B) Predicted effects of sa20221 on Cped1 amino acid sequence. For (A) and (B), information for w1003, an allele we previously described26, is shown for reference. (C) Mutant mRNA is degraded in cped1sa20221 mutants. RT-PCR for the region spanning exons 14 through 16 of cped1 in adult whole body tissues shows reduced transcript levels in cped1sa20221 mutants compared to controls. Evidence of exon skipping in exon 15 was not observed. PHENOTYPE:
|
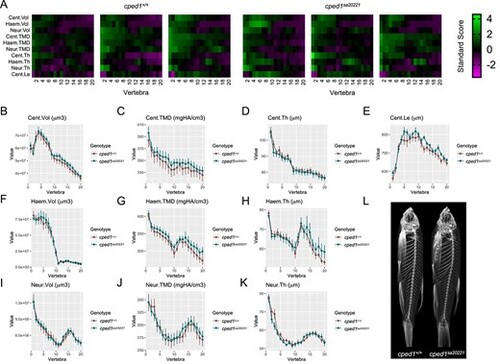
cped1sa20221 mutants exhibit normal vertebral bone mass and morphology. (A) Skeletal barcodes for cped1+/+ and cped1sa20221 mutants (3 fish/group shown) visually depict individual vertebral phenomes. (B-K) Vertebral phenotypic measures (indicated by the graph title, with units for y axis) plotted as a function of vertebra along the spine. Values are depicted mean ± SEM (n = 8/group). No measures with p < .05 in the global test were detected. (L) Maximum intensity projections of microCT scans. Cent, centrum; Haem, haemal arch; Neur, neural arch; Vol, volume; TMD, tissue mineral density; Th, thickness; Le, length. |
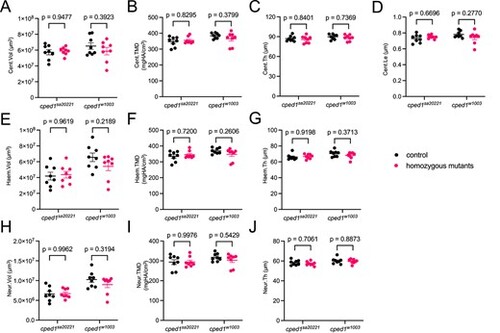
Loss of cped1 does not affect vertebral bone mass and morphology in multiple mutant lines. (A-J) Combined analysis of vertebral measurements for cped1sa20221 and cped1w1003 mutants compared to their respective wildtype clutchmates. Each point represents a single fish, and the value is the average of 16 measured vertebrae. Bars indicate mean ± SEM. Shown are p-values from Sidak’s multiple comparisons tests; no significant p-values for comparisons between homozygous mutants and respective controls were observed. PHENOTYPE:
|
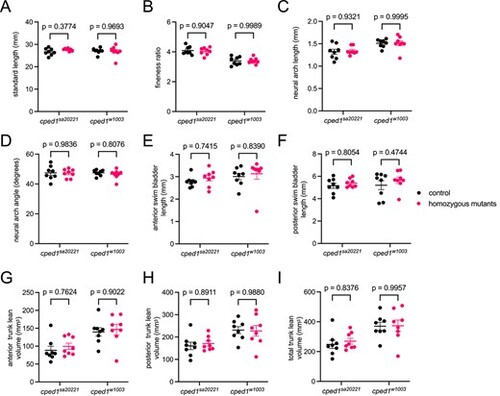
Loss of cped1 does not affect lean mass morphology. (A-I) Combined analysis of lean mass-related measures for cped1sa20221 and cped1w1003 mutants and their corresponding wildtype clutchmates. Each point represents a single fish. Bars indicate mean ± SEM. Shown are p-values from Sidak’s multiple comparisons tests; no significant p-values for comparisons between homozygous mutants and their respective controls were observed. PHENOTYPE:
|
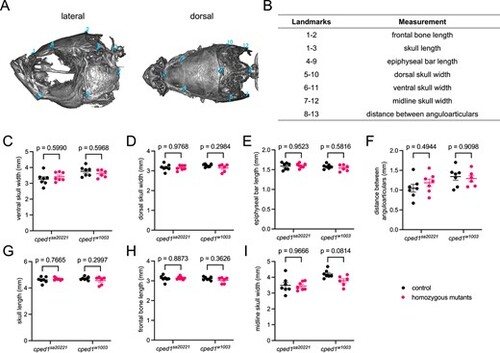
Loss of cped1 does not affect craniofacial morphology. (A) Anatomical landmarks used for measurements. Shown are the lateral view (left) and dorsal view (right) of a wildtype zebrafish skull. Landmark positions are labeled in blue. Note that landmark 11 is on the right lateral surface, opposite landmark 6, and landmark 13 is on the right lateral surface, opposite landmark 8. (B) Distances between pairs of landmarks were used as measurements to quantify craniofacial morphology. (C-I) Combined analysis of craniofacial morphological measures for cped1sa20221 and cped1w1003 mutants and their corresponding wildtype clutchmates. Each point represents an individual fish. Shown are p-values from Sidak’s multiple comparisons tests; no significant p-values for comparisons between homozygous mutants and controls were observed. PHENOTYPE:
|