IMAGE

Fig. 6

ID
ZDB-IMAGE-250303-6
Source
Figures for Escot et al., 2025
Image
Figure Caption

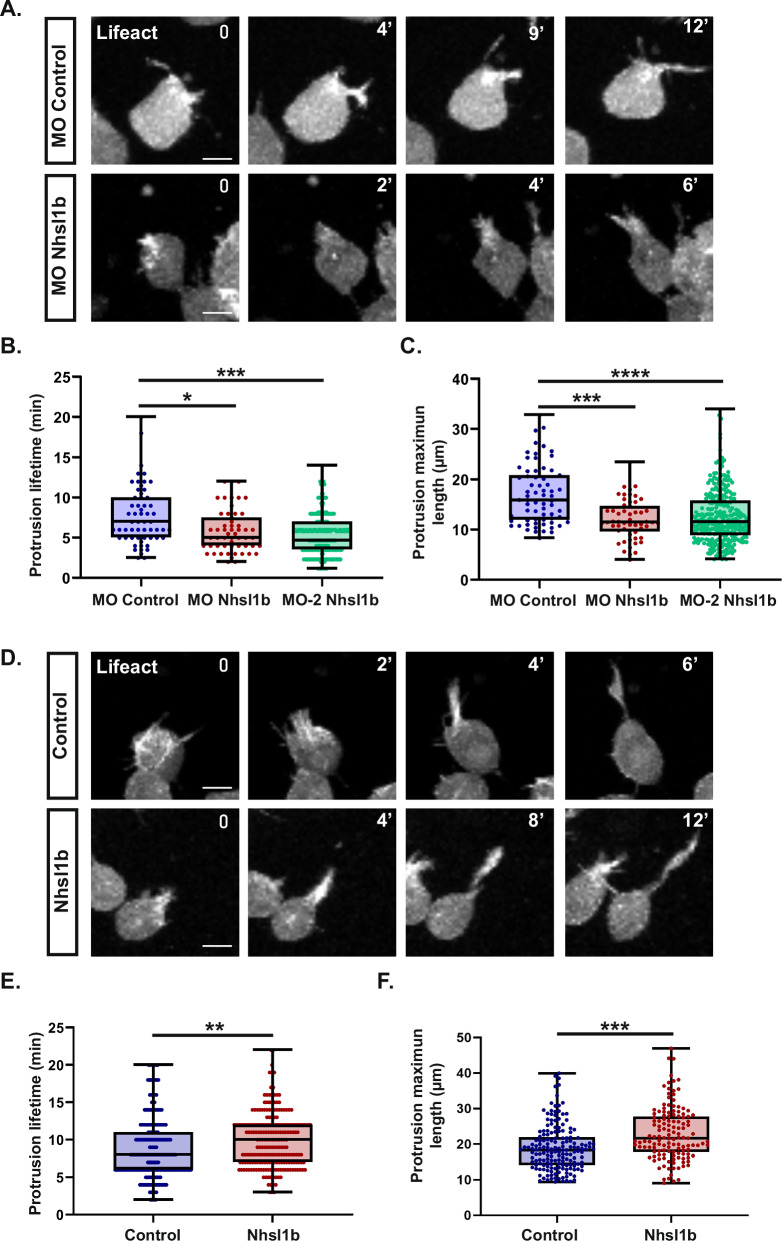
Fig. 6 Nhsl1b regulates protrusion dynamics.

A Protrusions of mesodermal cells injected with Lifeact-mCherry mRNAs and with a MO control or a MO Nhsl1b, transplanted in the mesoderm of a non-labelled embryo. Selected time points showing the protrusion elongation. B, C Quantification of the lifetime and maximum length of protrusions. Likelihood ratio test of a linear mixed effects model with treatment as a fixed effect and cells as a random effect against a model without the fixed effect. Adjusted p-values: (B) MO Control vs MO Nhsl1b: 0.0309*; MO Control vs MO-2 Nhsl1b: 0.0011 ***; (C) MO Control vs MO Nhsl1b: 0.0001***; MO Control vs MO-2 Nhsl1b: 4,89E−06****. MO Control (n = 5 embryos; n = 12 cells), MO Nhsl1b (n = 6 embryos; n = 14 cells) and MO-2 Nhsl1b (n = 7 embryos, 49 cells). D Protrusions of mesodermal cells injected with Lifeact-mCherry mRNAs and with lacZ (control) or Nhsl1b mRNAs, transplanted in the mesoderm of a non-labelled embryo. Selected time points showing the protrusion elongation. E, F Quantification of the lifetime and maximum length of protrusions. Likelihood ratio test of a linear mixed effects model with treatment as a fixed effect and cells as a random effect against a model without the fixed effect. p-values: E Control vs Nhsl1b: 0.0094**; (F) Control vs Nhsl1b: 0.00012***. Control (n = 5 embryos, 30 cells) or Nhsl1b (n = 6 embryos, 28 cells). Scale bars 20 µm.

Acknowledgments
This image is the copyrighted work of the attributed author or publisher, and ZFIN has permission only to display this image to its users. Additional permissions should be obtained from the applicable author or publisher of the image. Full text @ Commun Biol