|
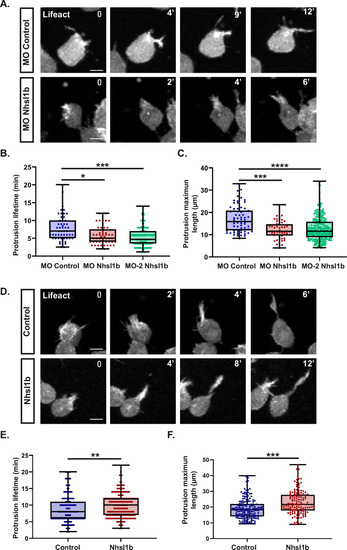
Nhsl1b regulates protrusion dynamics. A Protrusions of mesodermal cells injected with Lifeact-mCherry mRNAs and with a MO control or a MO Nhsl1b, transplanted in the mesoderm of a non-labelled embryo. Selected time points showing the protrusion elongation. B, C Quantification of the lifetime and maximum length of protrusions. Likelihood ratio test of a linear mixed effects model with treatment as a fixed effect and cells as a random effect against a model without the fixed effect. Adjusted p-values: (B) MO Control vs MO Nhsl1b: 0.0309*; MO Control vs MO-2 Nhsl1b: 0.0011 ***; (C) MO Control vs MO Nhsl1b: 0.0001***; MO Control vs MO-2 Nhsl1b: 4,89E−06****. MO Control (n = 5 embryos; n = 12 cells), MO Nhsl1b (n = 6 embryos; n = 14 cells) and MO-2 Nhsl1b (n = 7 embryos, 49 cells). D Protrusions of mesodermal cells injected with Lifeact-mCherry mRNAs and with lacZ (control) or Nhsl1b mRNAs, transplanted in the mesoderm of a non-labelled embryo. Selected time points showing the protrusion elongation. E, F Quantification of the lifetime and maximum length of protrusions. Likelihood ratio test of a linear mixed effects model with treatment as a fixed effect and cells as a random effect against a model without the fixed effect. p-values: E Control vs Nhsl1b: 0.0094**; (F) Control vs Nhsl1b: 0.00012***. Control (n = 5 embryos, 30 cells) or Nhsl1b (n = 6 embryos, 28 cells). Scale bars 20 µm.
|