IMAGE

Figure 6

ID
ZDB-IMAGE-250304-13
Source
Figures for Sertori et al., 2025
Image
Figure Caption

Figure 6

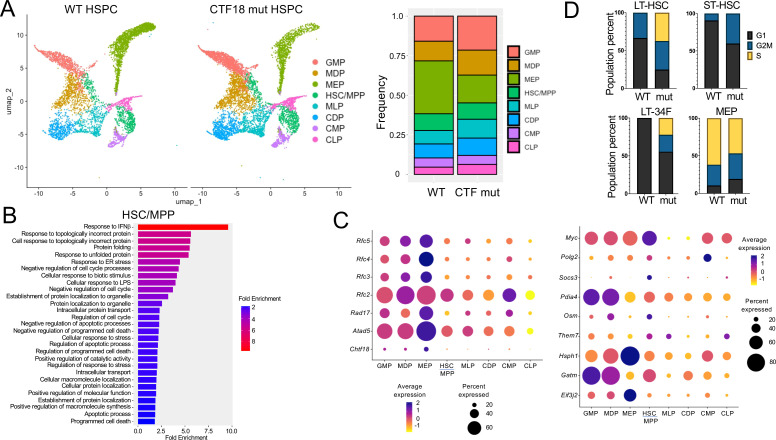
scRNA-Seq analysis of WT and Chtf18 mut HSPC.(A) Uniform Manifold Approximation Projection (UMAP) plots showing eight distinct HSPC clusters and their relative frequencies in Lineage- HSPC from Chtf18 wildtype and mut mice. (B) Gene Set Enrichment analysis (EnrichGo) of the highly variable expressed genes between Chtf18 wildtype and mut HSC/MPP cluster. (C) Bubble plot representation showing expression of DNA clamp loader proteins and top upregulated genes in the Chtf18 mut HSPCs. (D) Percentage of cells in G1, G2/M and S phase in Chtf18 WT and mut HSPCs. Reference cell type abbreviations: LT-34F, CD34+ Long-term reconstituting stem cell; LT-HSC, CD34- Long-term reconstituting stem cell; MEP, Megakaryocyte-Erythroid Progenitor; CMP, Common Myeloid Progenitor; GMP, Granulocyte-Monocyte Progenitor; MLP, Multilineage Progenitor; HSC/MPP, Hematopoietic Stem Cell and Multi-Potent Progenitor; CLP, Common Lymphoid Progenitor; MDP, Monocyte-Dendritic cell Progenitor; CDP, Common Dendritic cell Progenitor.

Acknowledgments
This image is the copyrighted work of the attributed author or publisher, and ZFIN has permission only to display this image to its users. Additional permissions should be obtained from the applicable author or publisher of the image. Full text @ Front Immunol