FIGURE SUMMARY
Title

Disruption of the moonlighting function of CTF18 in a patient with T-lymphopenia

Authors
Sertori, R., Truong, B., Singh, M.K., Shinton, S., Price, R., Sharo, A., Shultes, P., Sunderam, U., Rana, S., Srinivasan, R., Datta, S., Font-Burgada, J., Brenner, S.E., Puck, J.M., Wiest, D.L.
Source
Full text @ Front Immunol

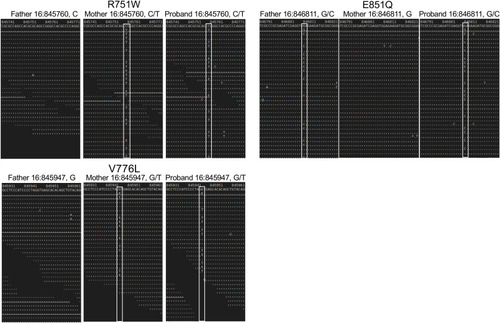
Sequence analysis of the parent and proband CHTF18 alleles. NextGen sequence traces of the paternal, maternal, and proband CHTF18 alleles are depicted, with the sequence variants boxed in white.

Structural analysis of CHTF18 patient variants.(A) The structure of human CTF18 is schematized with the structural domains and the location of variants inherited from the mother and father indicated above and below the diagram, respectively (52). NLS, nuclear localization signal; Pro, proline-rich domain; Ank, ankyrin repeat domain; TBD, triple barrel domain in red where CTF18 interacts with DSCC1 and CTF8 (53). (B-E) Clamp loader interface of either RFC1 or CTF18 with RFC3. (B) RFC1 structure (PDB #6VVO) shown in blue cylinders for helices and RFC3 in green. The ADP molecule (displayed with pink carbon atoms) bound by RFC3 is shown in ball-and-stick representation, and the key residues RFC1-986 and RFC3-R9 are labeled. (C) AF3 model of CTF18 (gold; residues 583-863) bound to RFC3. The wildtype R751 makes contact with RFC3-R9 in a similar manner compared to RFC1-R986. (D) AF3 model of the R751W variant makes more extensive contacts with RFC3-R9, changing the RFC-R9 rotamer conformation to where it makes 4 hydrogen bonds with RFC-D6 and the 3’ hydroxyl of ADP. (E) AF3 model of the CTF18-E851Q variant in a solvent exposed location distal from the RFC3 interface.

CHTF18 patient variants fail to support T cell development.(A) Effect of chtf18 knockdown on T cell development at 5 days post fertilization (dpf) in zebrafish embryos. T cell development was assessed by whole-mount in situ hybridization (WISH) using a probe for the T cell specific kinase, lck. Numbers on images represent the fractions of embryos with the depicted phenotype. Thymus is indicated by dashed blue ovals. (right panel) The efficacy of chtf18 E2I2 splice-blocking MO (1ng) was assessed by RT-PCR at 1 dpf. (B) Capacity of patient CHTF18 variants to rescue T cell development in zebrafish. Lateral images of zebrafish treated with control or chtf18 MO and subjected to rescue by heat-induced re-expression of the WT or mutant human CHTF18 orthologs. Rescue of T-cell development was evaluated by lck WISH at 5 dpf. Thymus staining is indicated by dashed blue ovals and the fraction of embryos with the depicted phenotype is indicated on each micrograph. The intensity of the lck WISH signal was quantified by ImageJ software and is depicted graphically as box and whisker plots. Statistical significance was evaluated using one way ANOVA. *p < 0.05; **p < 0.01; ***p < 0.001.

EXPRESSION / LABELING:
Gene:
Fish:
Knockdown Reagent:
Anatomical Term:
Stage: Day 5
PHENOTYPE:
Fish:
Knockdown Reagent:
Observed In:
Stage: Day 5

Phenotype of Chtf18 mutant mice.(A-C) Flow cytometric analysis of lymphoid development assessed by flow cytometry on thymus (A) and spleen (B, C). Flow cytometry analysis was performed on explanted thymus and spleen from adult WT (+/+) and Cht18 mut (R745W/E845Q) mice using the indicated antibodies to define the following populations in: (A) Thymus: CD4-CD8- (DN), CD4+CD8+ (DP), CD4+ (4SP), CD8 (8SP); (B) Spleen: B220+ (B cells); Thy1+ (T cells), CD4+, CD8+; (C) CD44+CD62L+ (effector memory); CD44+CD62L- (central memory). Absolute numbers of the indicated populations were depicted graphically as scatter plots with each symbol representing an individual animal. Statistical significance as assessed by multiple unpaired t tests.

Assessment of Chtf18 mut HSPC by competitive transplantation.(A, B) The ability of adult Chtf18 mut bone marrow HSPC to repopulate hematopoiesis was assessed by competitive transplantation using allotype marked (CD45.1) competitor. 100,000 Lineage HSPC from CD45.2 WT or Chtf18 mut mice were mixed with an equal quantity of CD45.1 competitor cells and transferred into irradiated recipients. After 6 weeks, the hematopoietic reconstitution was assessed on explanted thymus (A) and spleen (B) cell suspensions by flow cytometry using anti-CD45.1 and anti-CD45.2 antibodies. Cell frequencies were displayed graphically as scatter plots. Statistical significance was assessed by multiple unpaired t tests. (C) The capacity of CD45.2 WT and Chtf18 mut HSPC to home to the bone marrow was assessed as above expect that bone marrow seeding was measured by flow cytometry 4 days after transfer. The number of transferred cells found in the recipient bone marrow was exhibited by scatter plot. Statistical significance was assessed by multiple unpaired t tests.

scRNA-Seq analysis of WT and Chtf18 mut HSPC.(A) Uniform Manifold Approximation Projection (UMAP) plots showing eight distinct HSPC clusters and their relative frequencies in Lineage- HSPC from Chtf18 wildtype and mut mice. (B) Gene Set Enrichment analysis (EnrichGo) of the highly variable expressed genes between Chtf18 wildtype and mut HSC/MPP cluster. (C) Bubble plot representation showing expression of DNA clamp loader proteins and top upregulated genes in the Chtf18 mut HSPCs. (D) Percentage of cells in G1, G2/M and S phase in Chtf18 WT and mut HSPCs. Reference cell type abbreviations: LT-34F, CD34+ Long-term reconstituting stem cell; LT-HSC, CD34- Long-term reconstituting stem cell; MEP, Megakaryocyte-Erythroid Progenitor; CMP, Common Myeloid Progenitor; GMP, Granulocyte-Monocyte Progenitor; MLP, Multilineage Progenitor; HSC/MPP, Hematopoietic Stem Cell and Multi-Potent Progenitor; CLP, Common Lymphoid Progenitor; MDP, Monocyte-Dendritic cell Progenitor; CDP, Common Dendritic cell Progenitor.

Impact of Chtf18 variants on HSPC migration.(A) Gene Set Enrichment analysis (EnrichGo) of the highly variable expressed genes between Chtf18 WT and mut CLP cluster (upper panel). (Bottom Panel) Volcano plot of the top differentially expressed genes between Chtf18 WT and mut CLP cluster. (B) The impact of Ctf18 loss on the localization of HSPC in zebrafish embryos was examined by MO knockdown of chtf18 (chtf18e6), following which the location of HSPC in the caudal hematopoietic tissue was assessed by WISH using a probe for runx1. Statistical significance was assessed by Fisher’s Exact Test, with the p=6.8x10⁻⁷ for Con. vs Ctfe6.

EXPRESSION / LABELING:
Gene:
Fish:
Knockdown Reagent:
Anatomical Term:
Stage: Prim-25
PHENOTYPE:
Fish:
Knockdown Reagent:
Observed In:
Stage: Prim-25

ZFIN is incorporating published figure images and captions as part of an ongoing project. Figures from some publications have not yet been curated, or are not available for display because of copyright restrictions.

EXPRESSION / LABELING:
Gene:
Fish:
Knockdown Reagents:
Anatomical Term:
Stage: Day 5
PHENOTYPE:
Fish:
Knockdown Reagents:
Observed In:
Stage: Day 5

ZFIN is incorporating published figure images and captions as part of an ongoing project. Figures from some publications have not yet been curated, or are not available for display because of copyright restrictions.

Acknowledgments
This image is the copyrighted work of the attributed author or publisher, and ZFIN has permission only to display this image to its users. Additional permissions should be obtained from the applicable author or publisher of the image. Full text @ Front Immunol