|
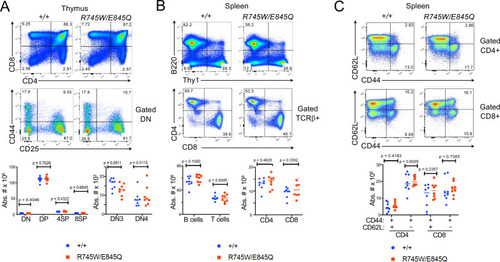
Phenotype of Chtf18 mutant mice.(A-C) Flow cytometric analysis of lymphoid development assessed by flow cytometry on thymus (A) and spleen (B, C). Flow cytometry analysis was performed on explanted thymus and spleen from adult WT (+/+) and Cht18 mut (R745W/E845Q) mice using the indicated antibodies to define the following populations in: (A) Thymus: CD4-CD8- (DN), CD4+CD8+ (DP), CD4+ (4SP), CD8 (8SP); (B) Spleen: B220+ (B cells); Thy1+ (T cells), CD4+, CD8+; (C) CD44+CD62L+ (effector memory); CD44+CD62L- (central memory). Absolute numbers of the indicated populations were depicted graphically as scatter plots with each symbol representing an individual animal. Statistical significance as assessed by multiple unpaired t tests.
|