
|
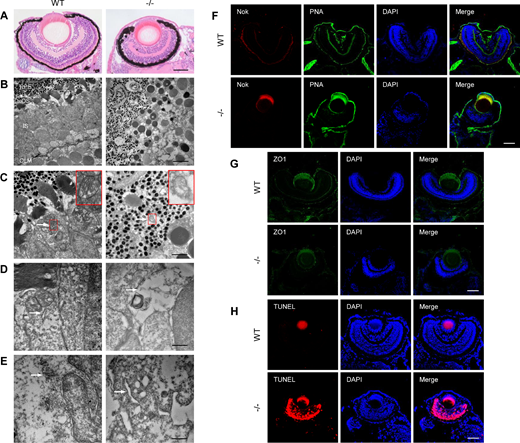
Fig. 3 Retinal degeneration in dync1h1−/− zebrafish at 5 dpf. (A) Representative H&E-stained images of WT and dync1h1−/− retina. (B–E) TEM images of WT and dync1h1−/− retina. (B) Overview of the outer retina. (C) Mitochondria indicated by white arrows and zoom-in pictures shown in the red rectangle. (D) ER (white arrow). (E) Golgi (white arrow). (F) Immunofluorescence-stained cryosections showing PRC IS/OS using anti-Nok and PNA; nuclei are stained by DAPI. (G) Immunofluorescence-stained cryosections showing OLM integrity using anti-ZO1; nuclei stained by DAPI. (H) TUNEL assay images with DAPI-stained nuclei. −/−, dync1h1 homozygote. Scale bar = 50 µm (A, F–H), 5 µm (B), 2 µm in (C), 500 nm (D, E). DAPI, 4′,6-diamidino-2-phenylin-dole; dpf, days post fertilization; ER, endoplasmic reticulum; H&E, hematoxylin and eosin; IS/OS, inner segment/outer segment; Nok, nagie oko; ONL, outer nuclear layer; PNA, peanut agglutinin; PRC, photoreceptor cell; WT, wild type.