IMAGE

Fig. 2.

ID
ZDB-IMAGE-250324-48
Source
Figures for Gang et al., 2025
Image
Figure Caption

Fig. 2.

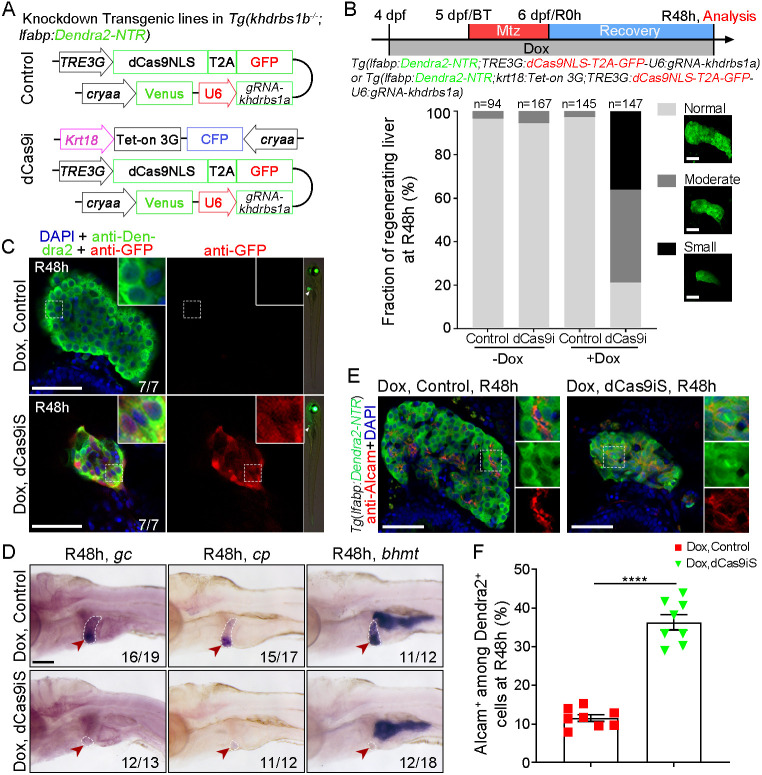
Specific inactivation of khdrbs1 in BECs causes impaired biliary-mediated liver regeneration. (A) Schematic showing CRISPR/dead Cas9-mediated interference (dCas9i) to knock down khdrbs1 in BECs, combined with doxycycline (Dox)-induced Tet-on3G/TRE3G system and constructed in the background of khdrbs1b−/− mutants. (B) Scheme showing the treatment of Dox and Mtz and then analysis at R48 h. Graph shows the percentage of regenerating livers of the control and dCas9i groups at R48 h with or without Dox. Images show examples of the normal, moderate and small categories. ‘Normal’ represents a regenerating liver size comparable to that of wild type. ‘Small’ represents a severe deficiency of liver regeneration compared to wild type. (C) Right-hand images: Epifluorescence images showing the body shape and regenerating livers (white arrowheads). Main panels: Confocal images showing the regenerating livers of control and small regenerated liver in the dCas9i group (dCas9iS) at R48 h. Insets show magnified views of regions of interest. (D) WISH images showing the expressions of gc, cp, and bhmt at R48 h. Red arrowheads and white dashed outlines indicate livers. Scale bar: 100 μm. (E) Confocal images showing the expression of Alcam and Dendra2 at R48 h. Scale bars: 50 μm. (F) Quantification of Alcam+ among Dendra2+ cells in regenerating livers at R48 h. Error bars represent s.e.m. ****P<0.0001 (two-tailed, unpaired t-test; control group, n=7; dCas9iS subgroup, n=8.). Numbers at the bottom of images indicate the proportion of larvae exhibiting the expression shown.

Acknowledgments
This image is the copyrighted work of the attributed author or publisher, and ZFIN has permission only to display this image to its users. Additional permissions should be obtained from the applicable author or publisher of the image. Full text @ Development